Options Data API
Get live, delayed, and historical end-of-day options data back to 2007 augmented with hundreds of proprietary indicators.
- 15+
- Years of data
- 5,000+
- Symbols
- 500+
- Indicators
ORATS data quality is superbly better than others in the market, with Greeks and other volatility fields in the API.
Former Microsoft engineer, multi-year client, February 2026
Delayed Data API
Perfect for getting started
$199
/ month
Includes:
- 20,000 requests per month
- Tickers
- Strikes + Near EOD History
- Strikes by OPRA + Near EOD History
- Monies Implied + Near EOD History
- Monies Forecast + Near EOD History
- SMV Summaries + Near EOD History
- Core Data + Near EOD History
- Daily Price
- Historical Volatility
- Earnings History
- Stock Split History
- IV Rank + History
Add Tools APIs:
NEWGet all this with an Options Data API subscription
History
Query end-of-day data for any option imaginable.
All US equity options including stocks, ETFs, and indexes.
30+ tickers for component weighted averages.
Full history dating back to 2007.
Strikes
Get high quality bid ask quotes and greeks.
Gathered 14 minutes before the close to avoid wide spreads.
Cleaned using our Smoothed Market Values system.
Includes ORATS theoretical price value estimate.
Core Data
Track over 100 indicators for every stock.
Correlations and ratios between components and ETFs.
Historical volume and pre/post earnings price moves.
Proprietary ORATS forecasts of implied volatility and slope.
Volatility Data
Measure volatility under any circumstance.
Historical stock intraday volatility vs close-to-close.
IV rank and percentiles for the last month and year.
Skewness and kurtosis indicators for the implied volatility surface.
Indicators
Over 500 proprietary indicators ride along with the data, from implied volatility forecasts to earnings move history.
Tools APIs
The tools in the dashboard, as APIs you can call.
The Option Scanner, Options Backtester, Intraday Backtester, and Time and Sales all run on engines inside the ORATS dashboard. These four APIs call those same engines and return what the dashboard renders: ranked candidates, stored backtest results, minute-level backtest reports, and trade prints with greeks. Each one is a flat monthly add-on to the data plan you already have, $99 or $299 depending on the API.
- 5,000+
- scannable symbols
- 300M+
- backtests searchable
- 1-min
- bars since Oct 2020
- Tick-level
- prints since Sep 2022
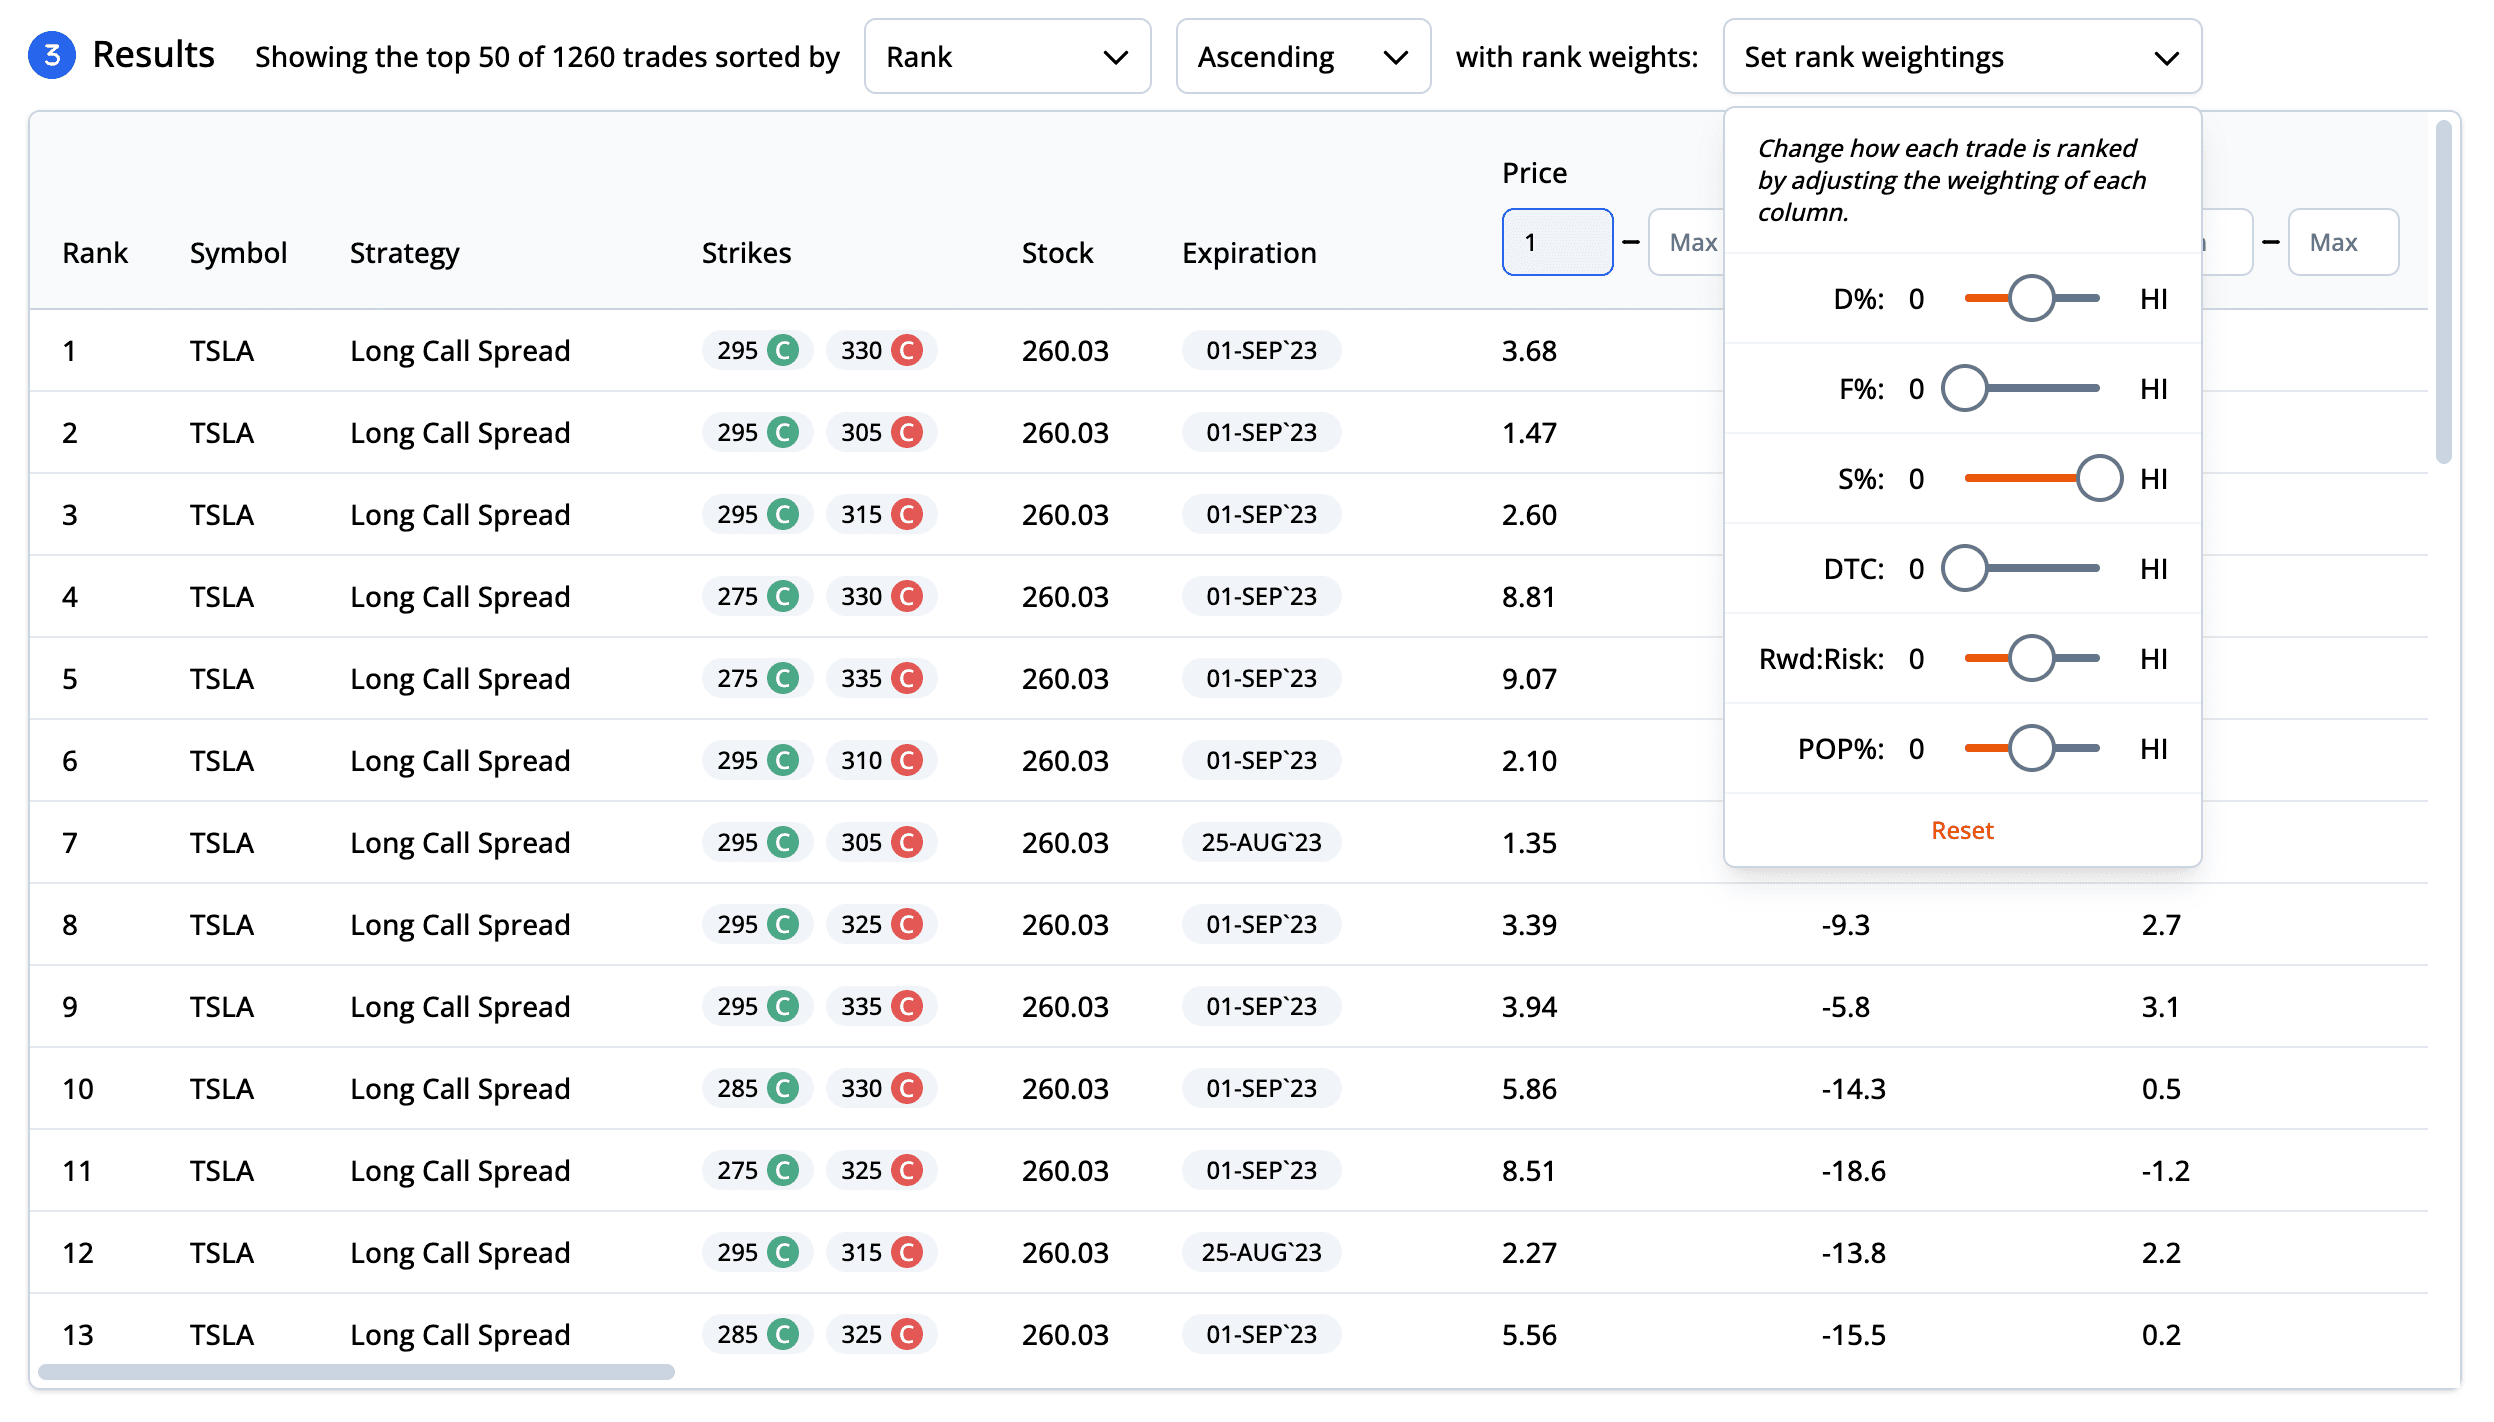
Option Scanner API
One POST scans every symbol you list.
Describe a strategy once: the legs, the delta and DTE bands, the strike widths between legs. List the symbols in the same body and the scanner scans their live or delayed chains and ranks what it finds. Every candidate comes back with pricing, greeks, probability of profit, and risk metrics.
- The dashboard's strategy JSON
- The body is the same strategy definition the dashboard builds. Symbols go in general.symbols, then one entry per leg with a delta target, its min and max band, a DTE band, and leg relations for strike widths. Scanning more symbols takes longer, so start with a few symbols.
- Distribution analytics on a flag
- Turn on distribution and every candidate comes back with probability of profit, max gain, max loss, breakevens, and risk. You set the drift, so you can run the same scan under a bullish or a bearish assumption.
- Live or delayed feeds
- Set dataSource to real-time or delayed quotes. The request and response formats are the same either way, so switching feeds is a one-word change.
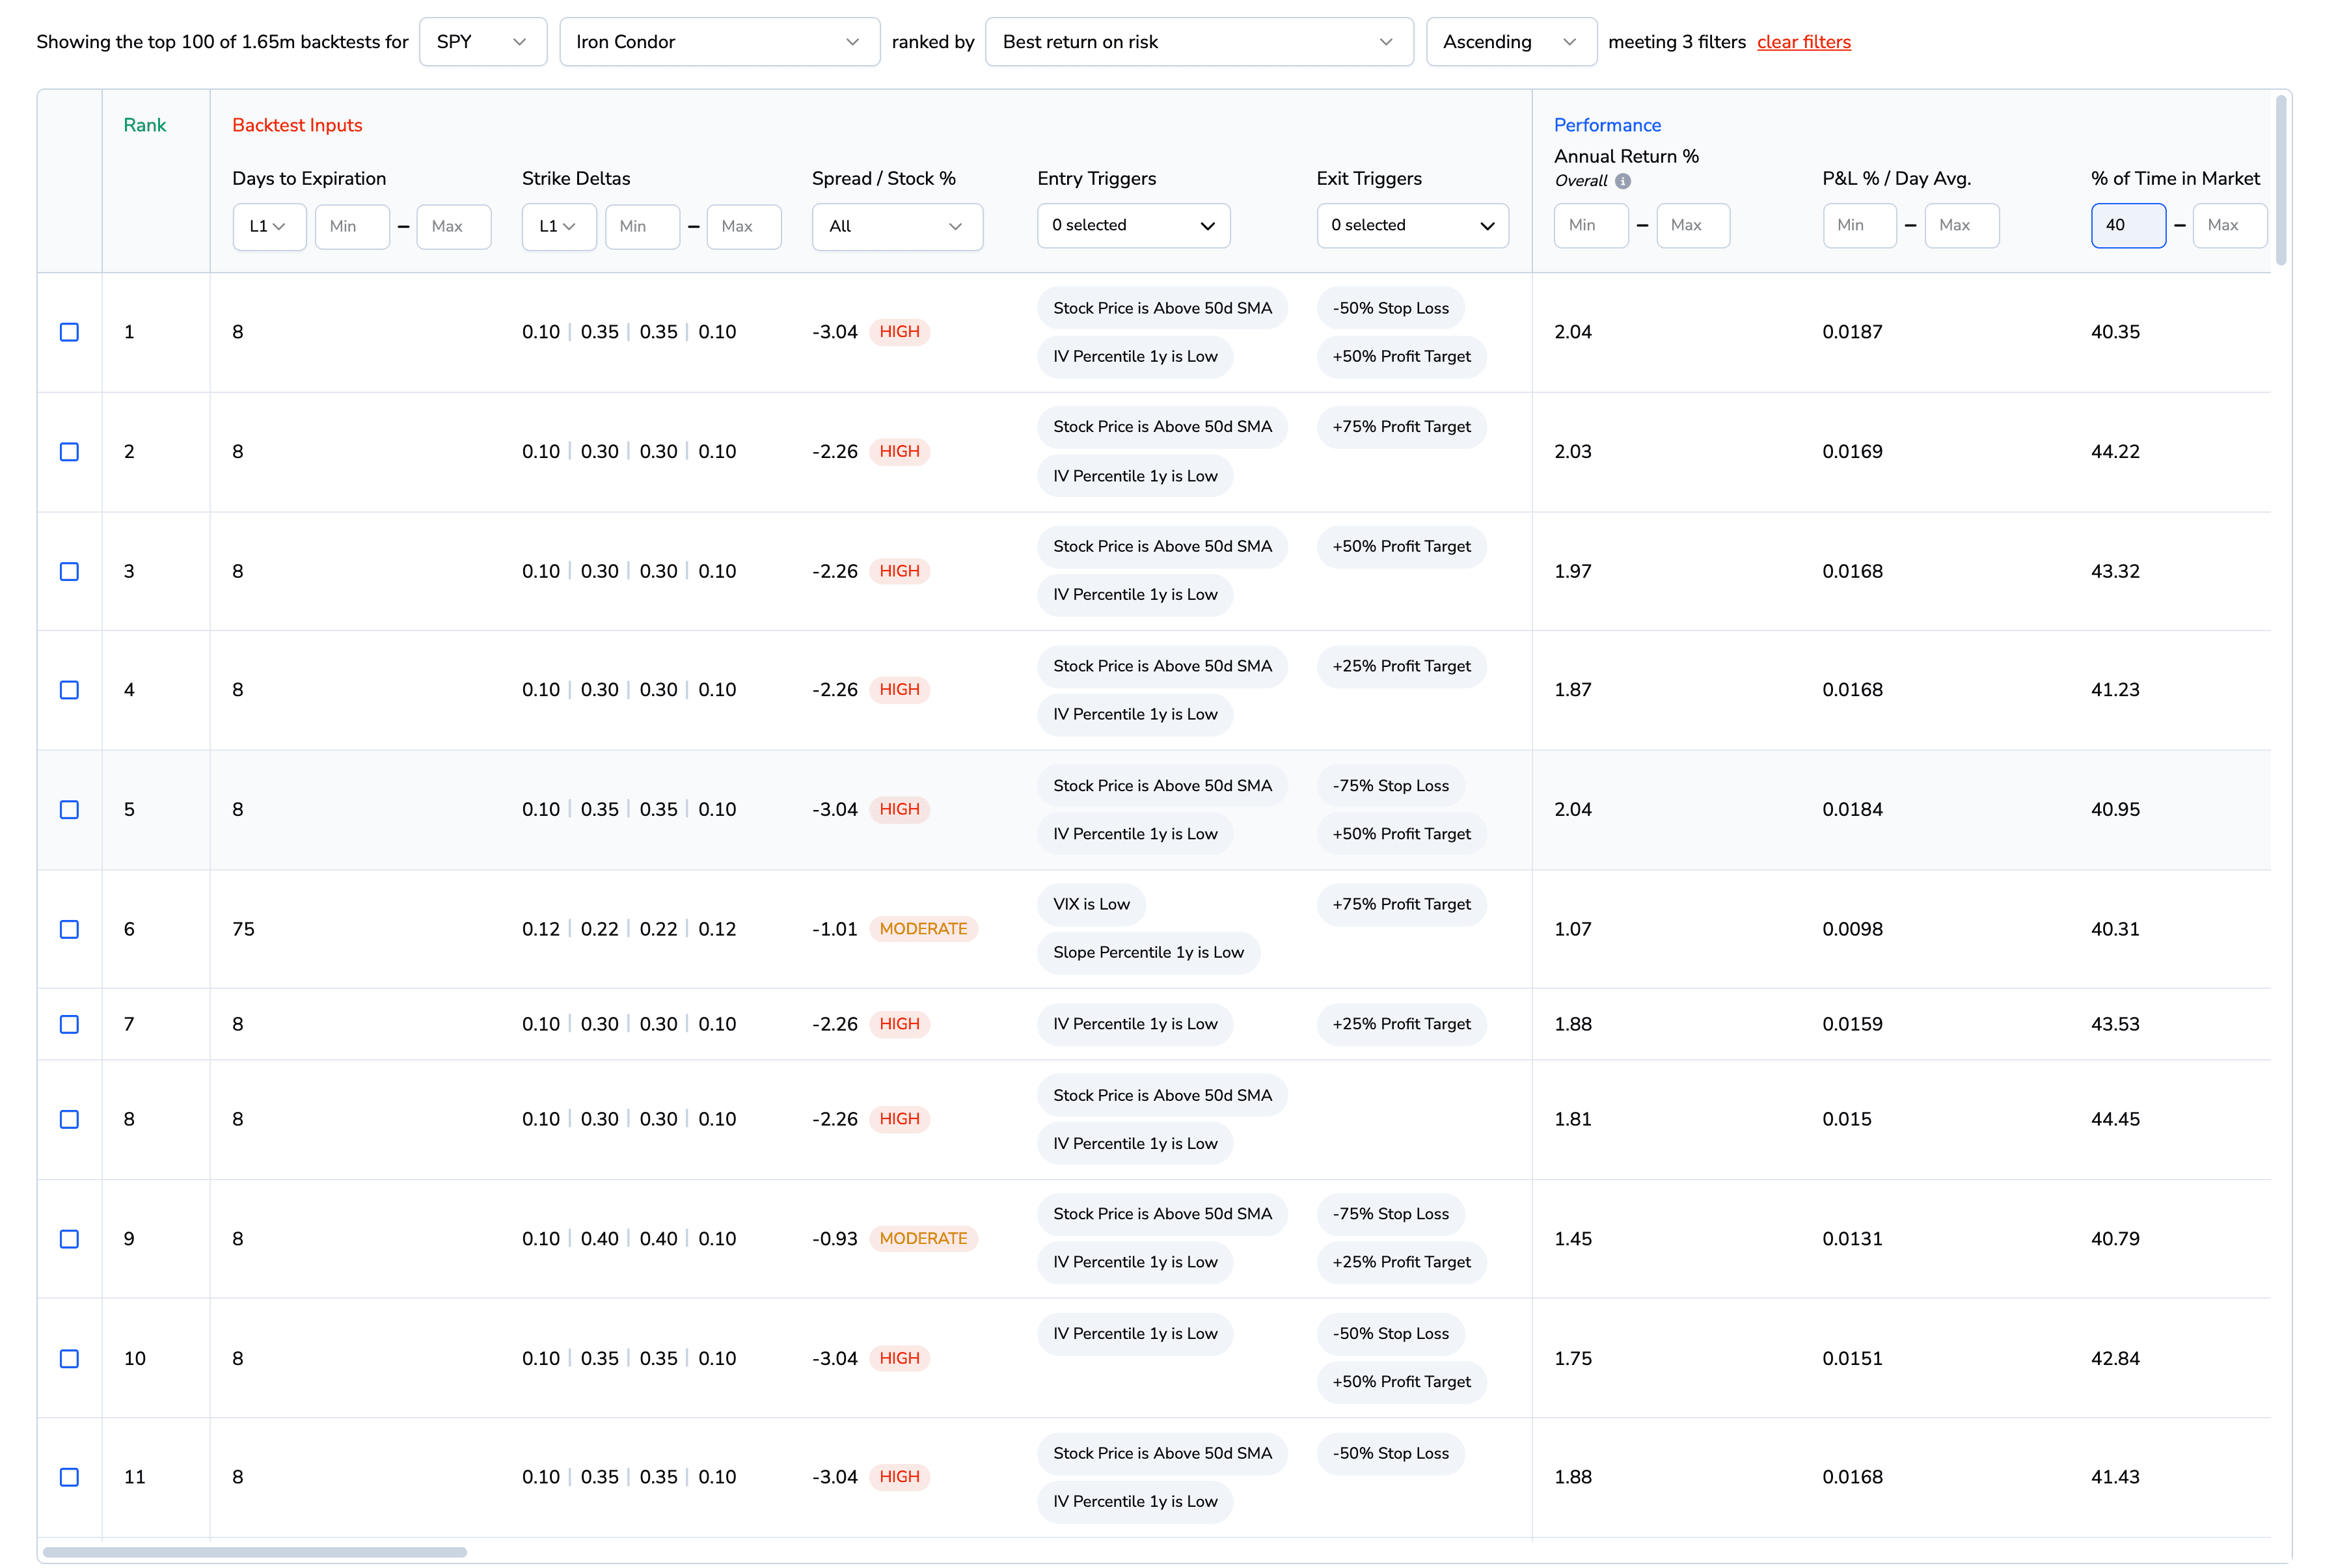
Backtest Finder API
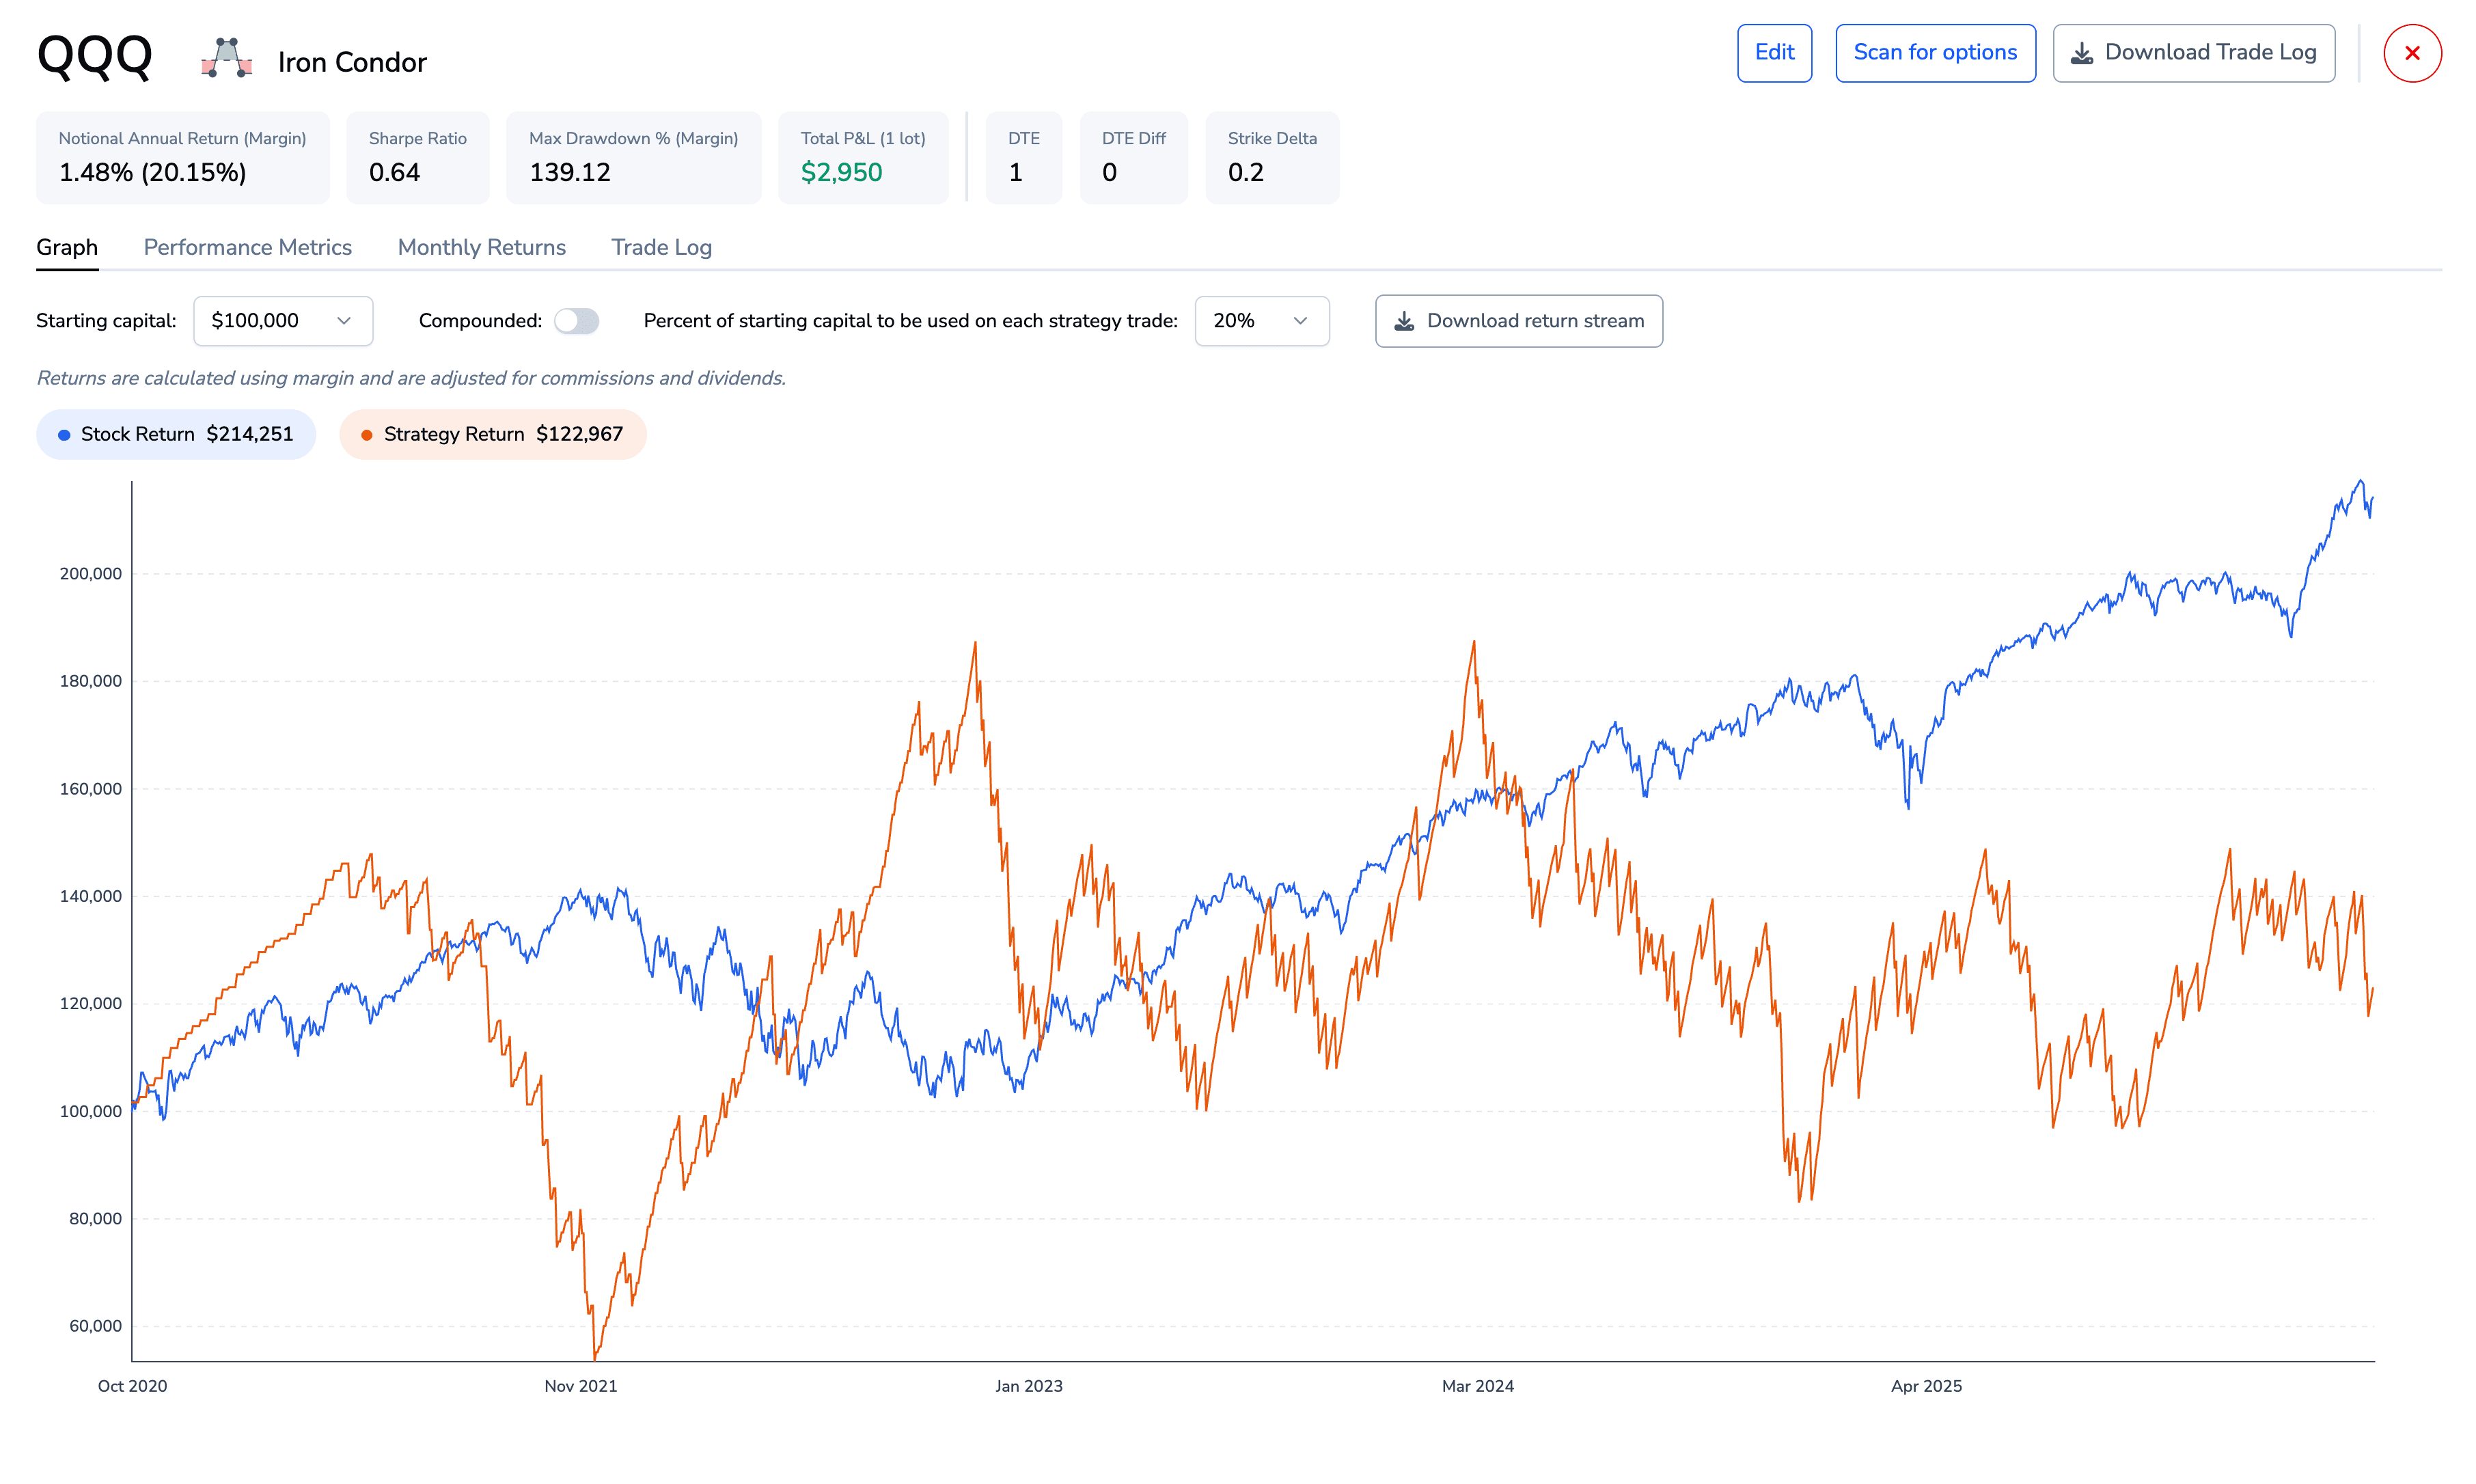
300 million backtests, already run.
Fifteen strategies, 300 million precomputed backtests. Ask for the best SPY iron condors by return on risk and up to 100 ranked rows come back. Every row has an id, and that id returns the full record: summary stats, monthly returns, the trade log, daily returns.
- Start from the catalog
- One GET returns every ticker, the strategies precomputed for it, and how many backtests exist for each pairing. Call it first: asking for a combination that was never precomputed returns a 500.
- Composite or raw-metric rankings
- Rank by bestReturnOnRisk, or by a raw metric like sharpe, sortino, annualReturn, or maxDrawDown. Metric bands filter the rows before ranking.
- Match today's market
- Send a currentEnvironment object with today's VIX, SMA, RSI, IV percentile, and slope, and you get back only the backtests whose entry triggers would fire right now.
Intraday Backtester API
Submit a job, poll it, fetch the results.
This is the engine behind the dashboard’s intraday mode. It checks your entries, exits, stops, and profit targets against every one-minute bar back to October 2020, which is why it runs as a job rather than a single request. Two weeks on one symbol usually finishes in under a minute.
- 0DTE-native inputs
- Entries and exits are clock times. DTE starts at 1, so a same-day expiration is simply DTE 1 and the band goes up to 30. SPX AM and PM expirations both work.
- Slippage and commissions included
- You set the slippage as a fraction of the spread paid on each side and the commission per contract per leg. A bad-price filter drops entries whose markets are too wide to trade, at 5% of strike and 15% of mid unless you say otherwise.
- The whole report back
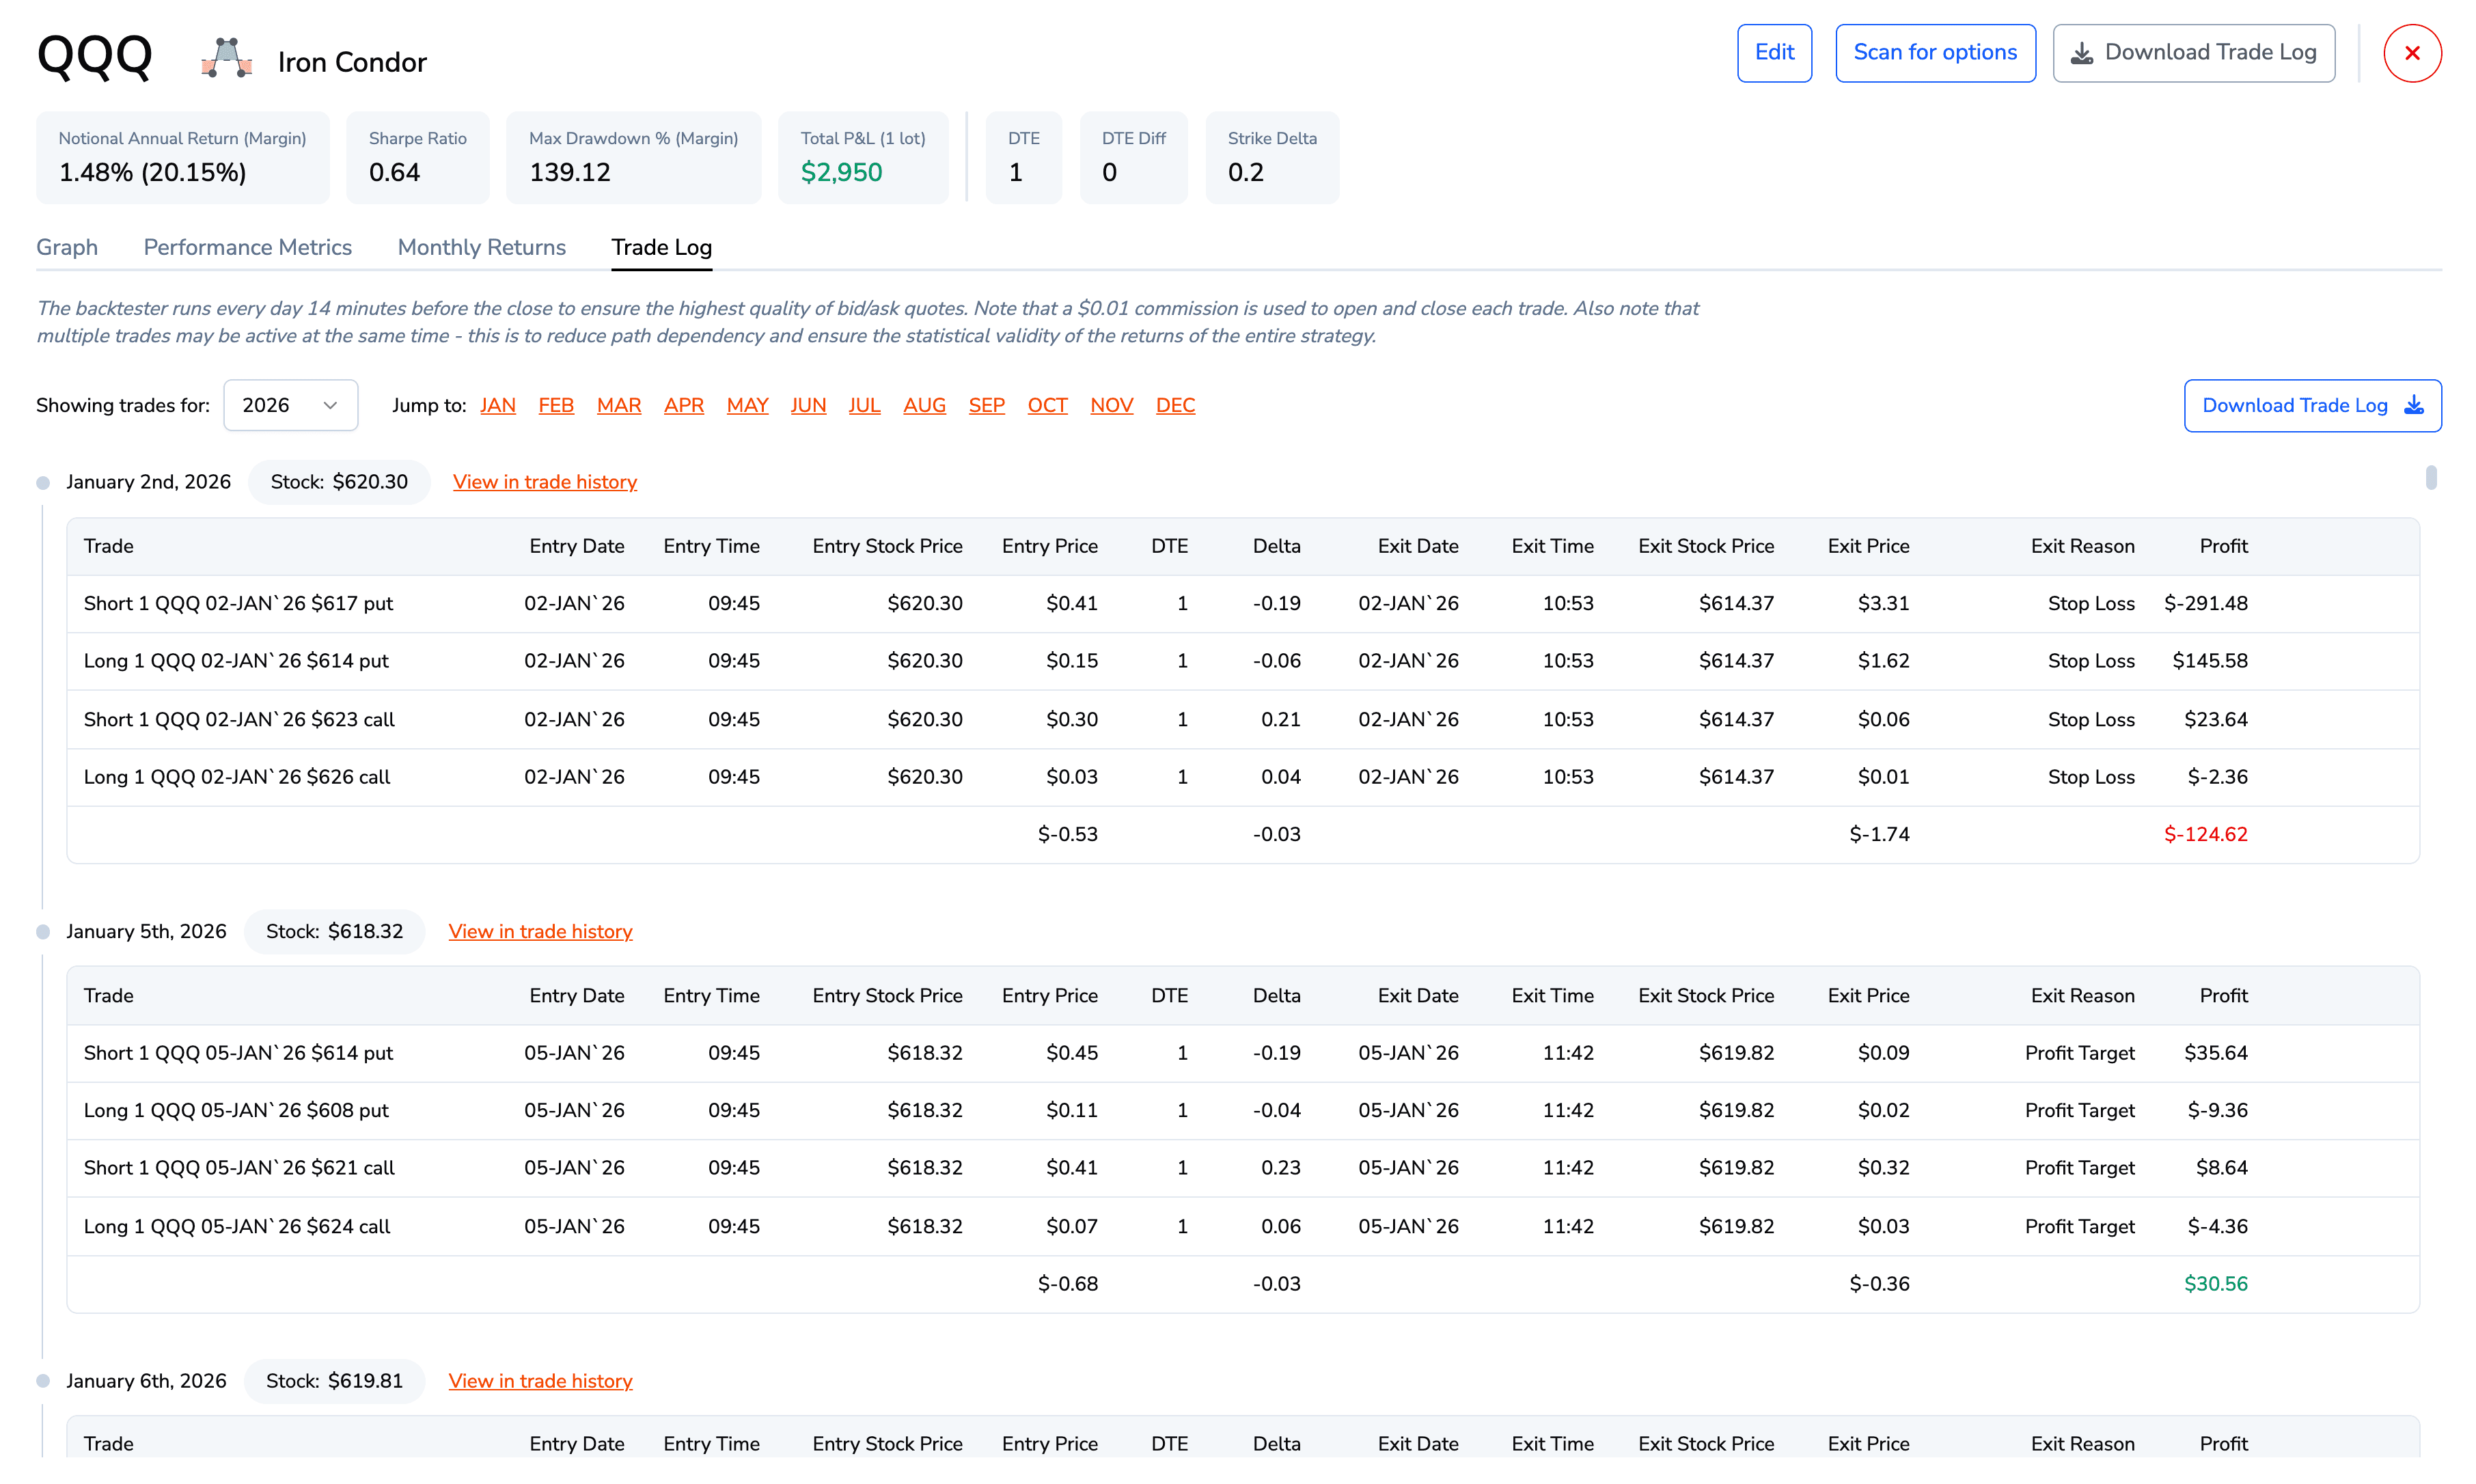
- A status poll returns progress and the main stats while the job runs. The results call returns the summary, monthly and daily returns, and a trade log with per-leg entry and exit times and the reason each trade closed.
Time & Sales API
Every print, with its greeks attached.
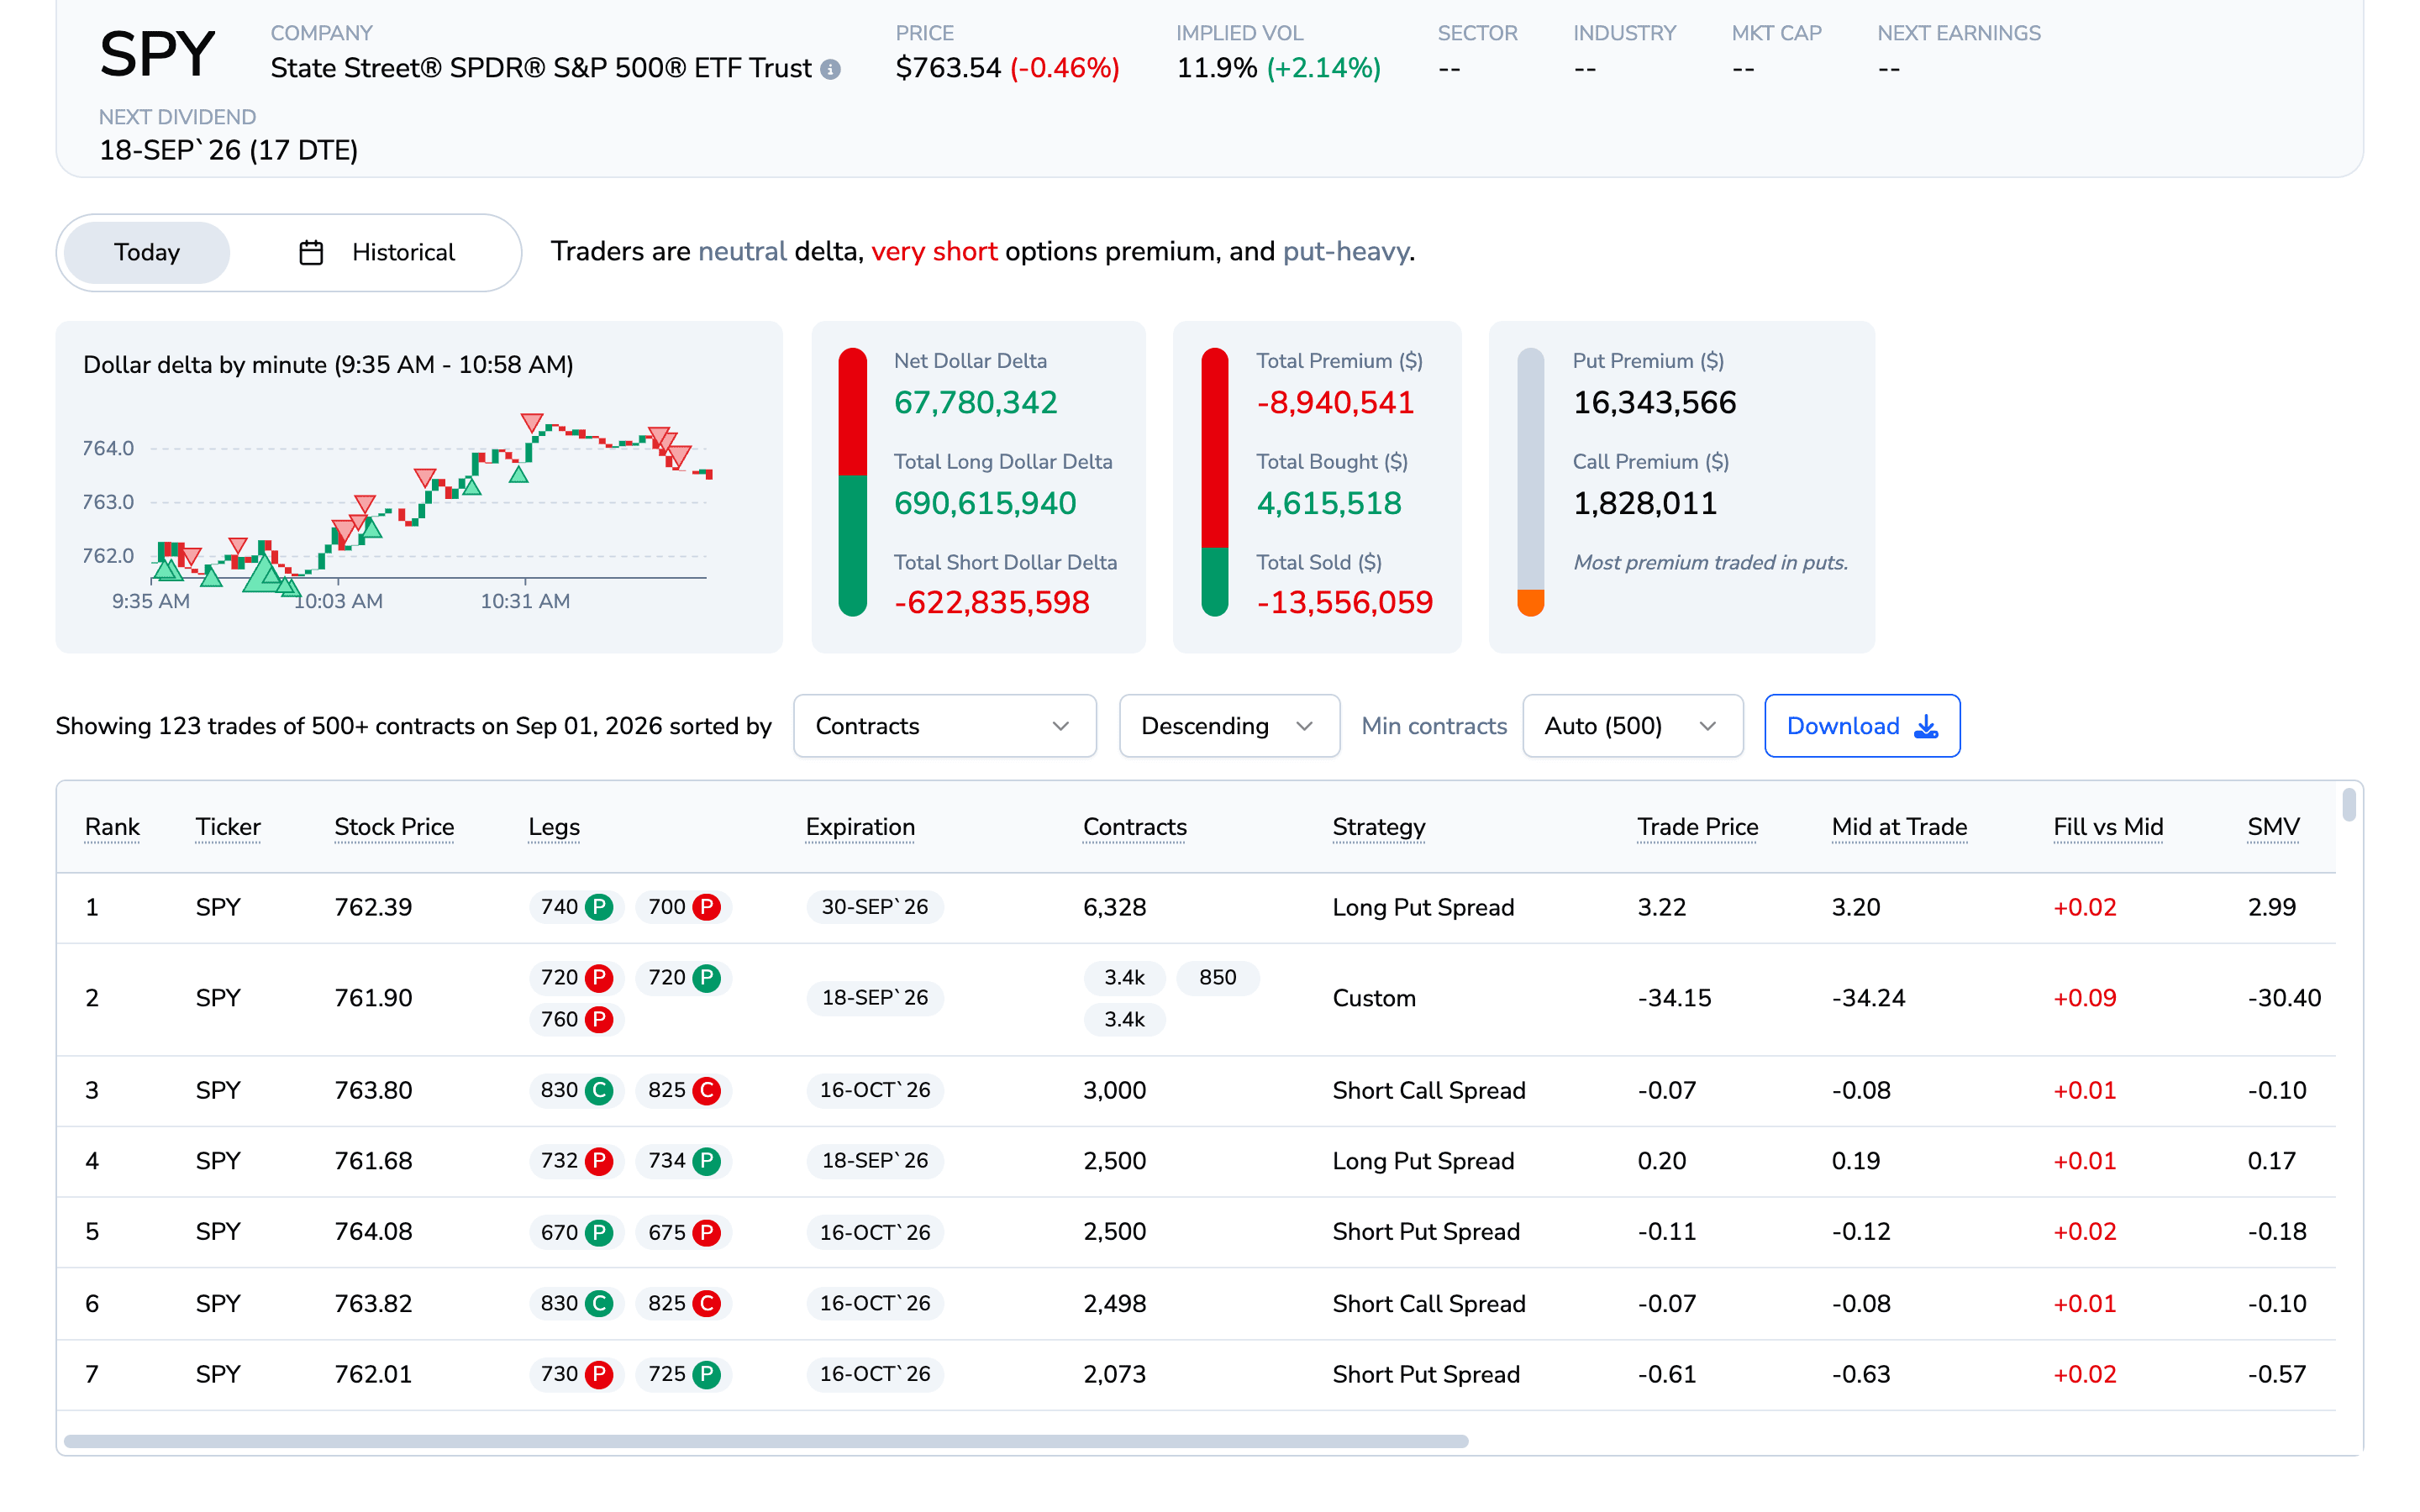
Tick-level option trade prints, live and back to September 9, 2022. Ask for a whole chain or one contract on a given trade date, narrow it to a window of the session, and drop anything under the size you care about.
- Greeks joined to every print
- Every option print arrives with delta, gamma, implied volatility, and the underlying stock price, joined from the ORATS one-minute greeks snapshot for that minute. You can see how far in or out of the money the trade was without a second lookup.
- A whole chain or one contract
- Pull a whole chain, one expiration, one strike, or a single OCC symbol. A time window and a minimum size narrow it further.
- Whole days as files
- A day of SPY option prints exceeds 1.5 million rows, so whole-day pulls redirect to a compressed file rather than return the rows inline. The first request for a day builds that file in about 20 seconds; later requests take about two. Add .csv to the path for CSV instead of JSON.
Examples
See them in the dashboard.
scroll
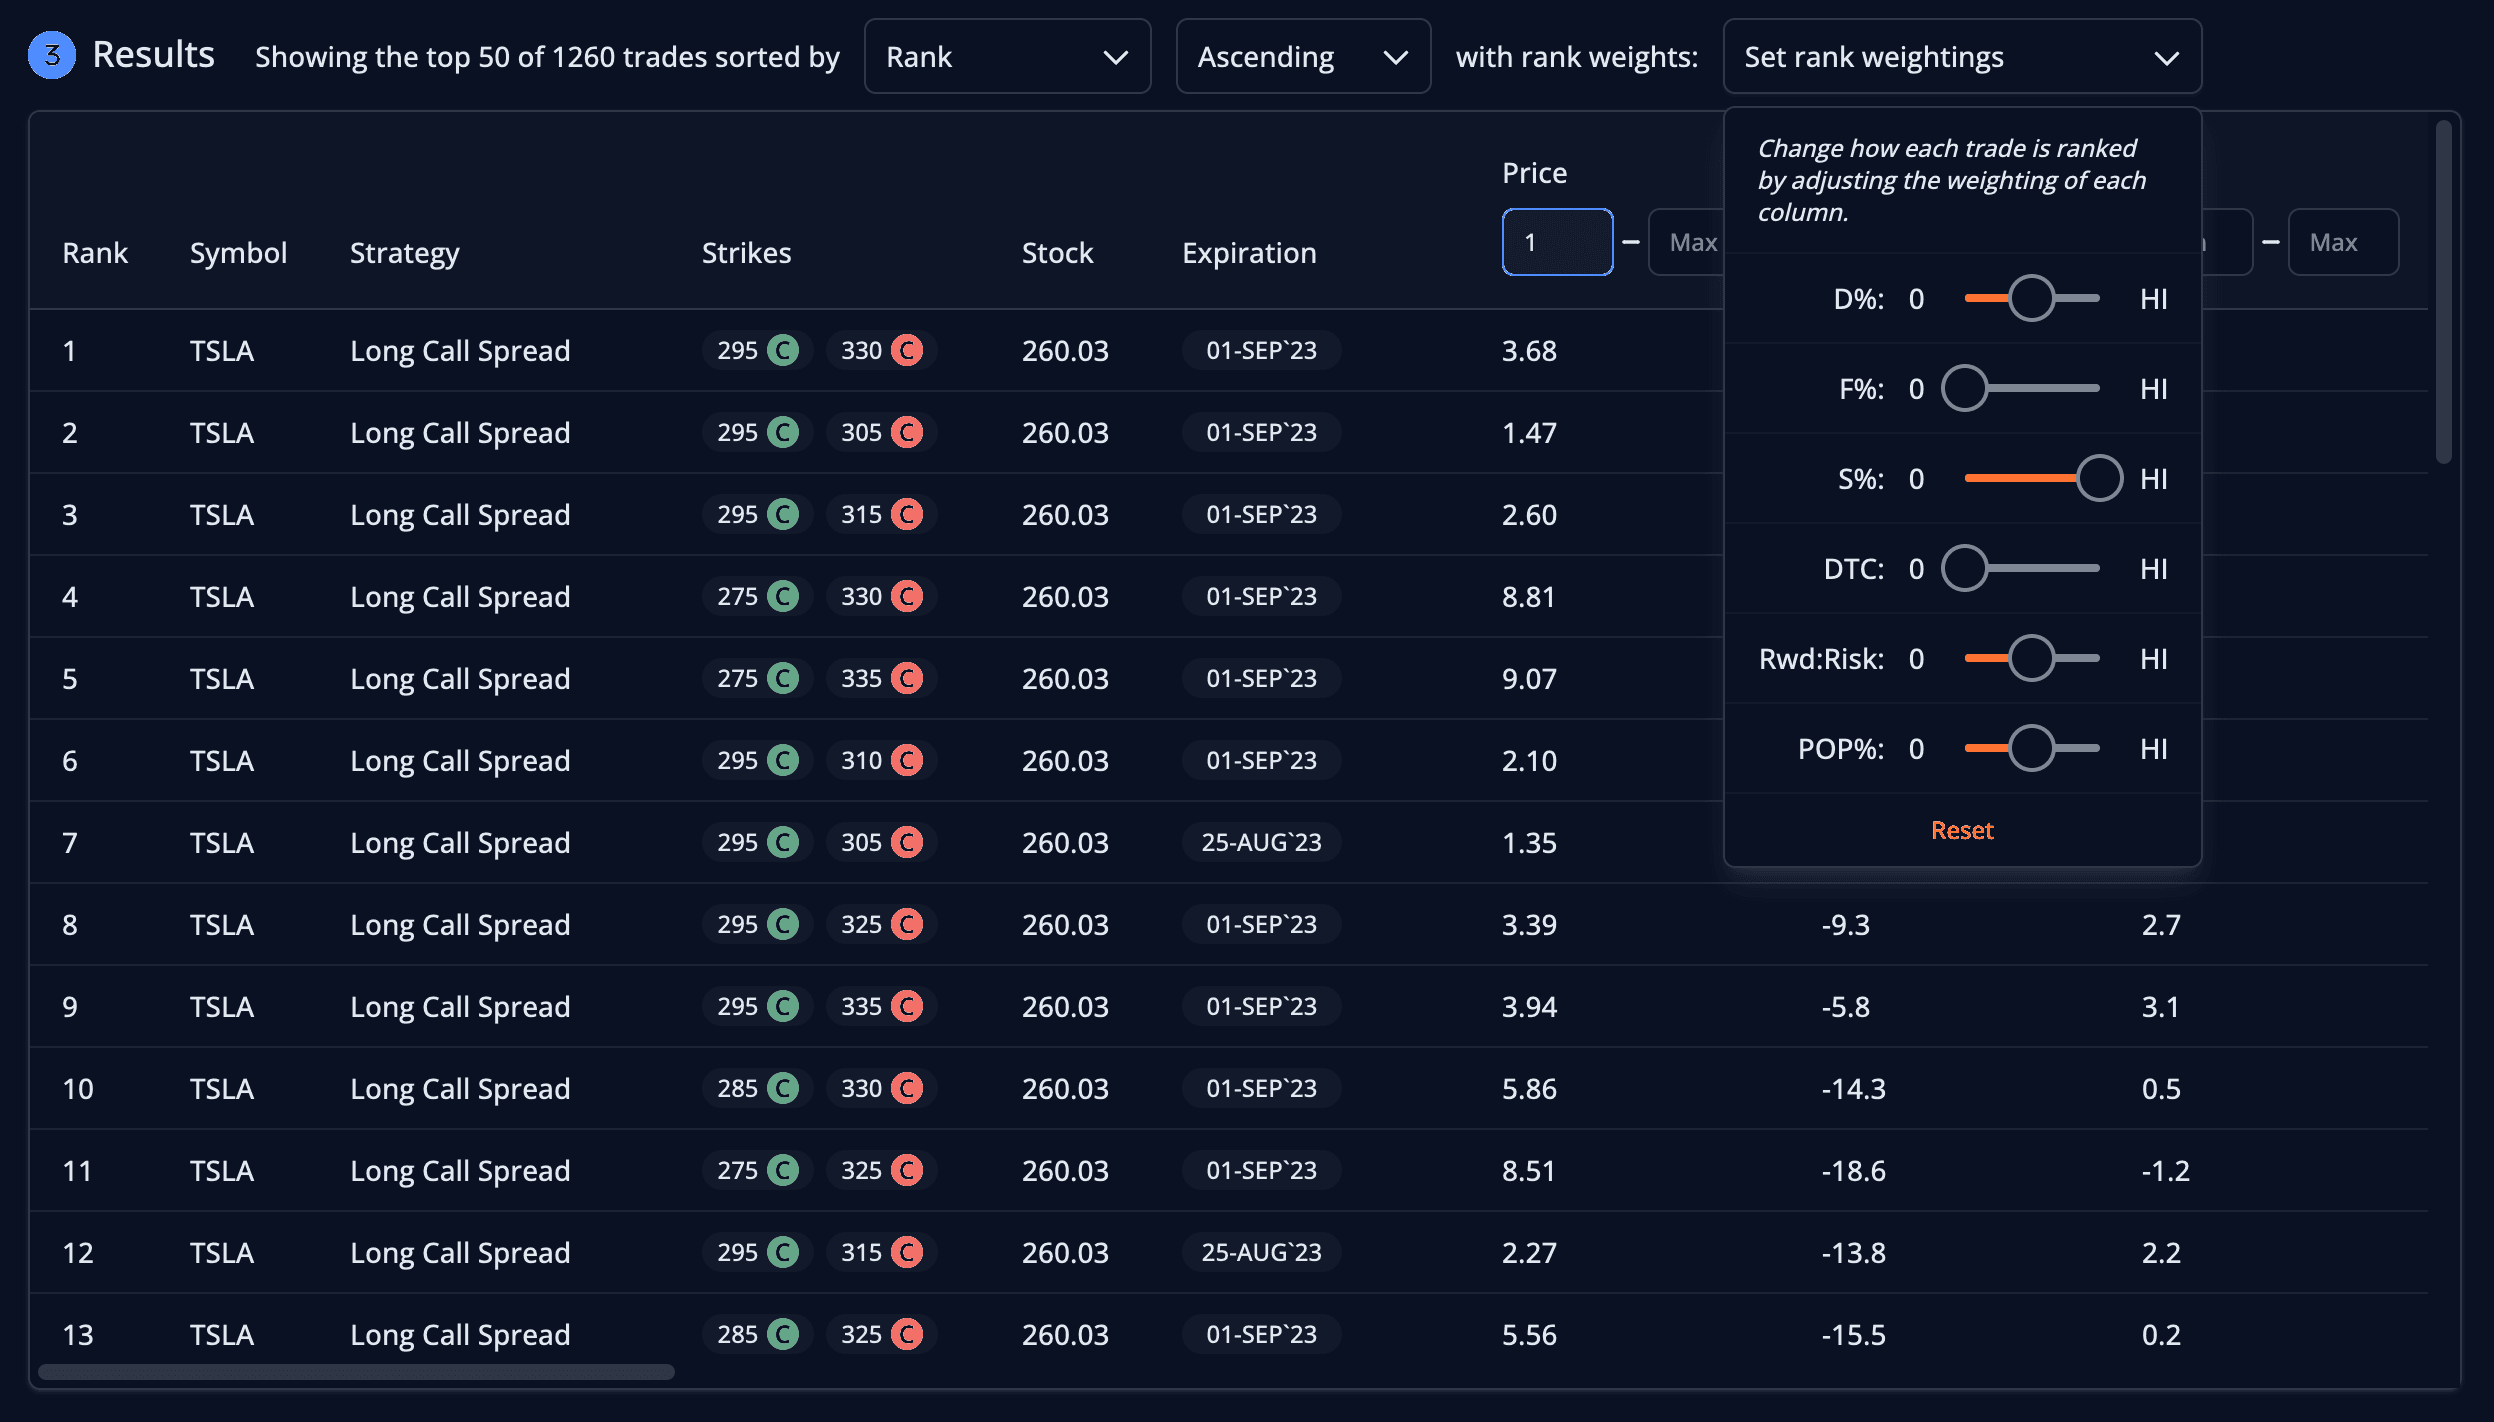
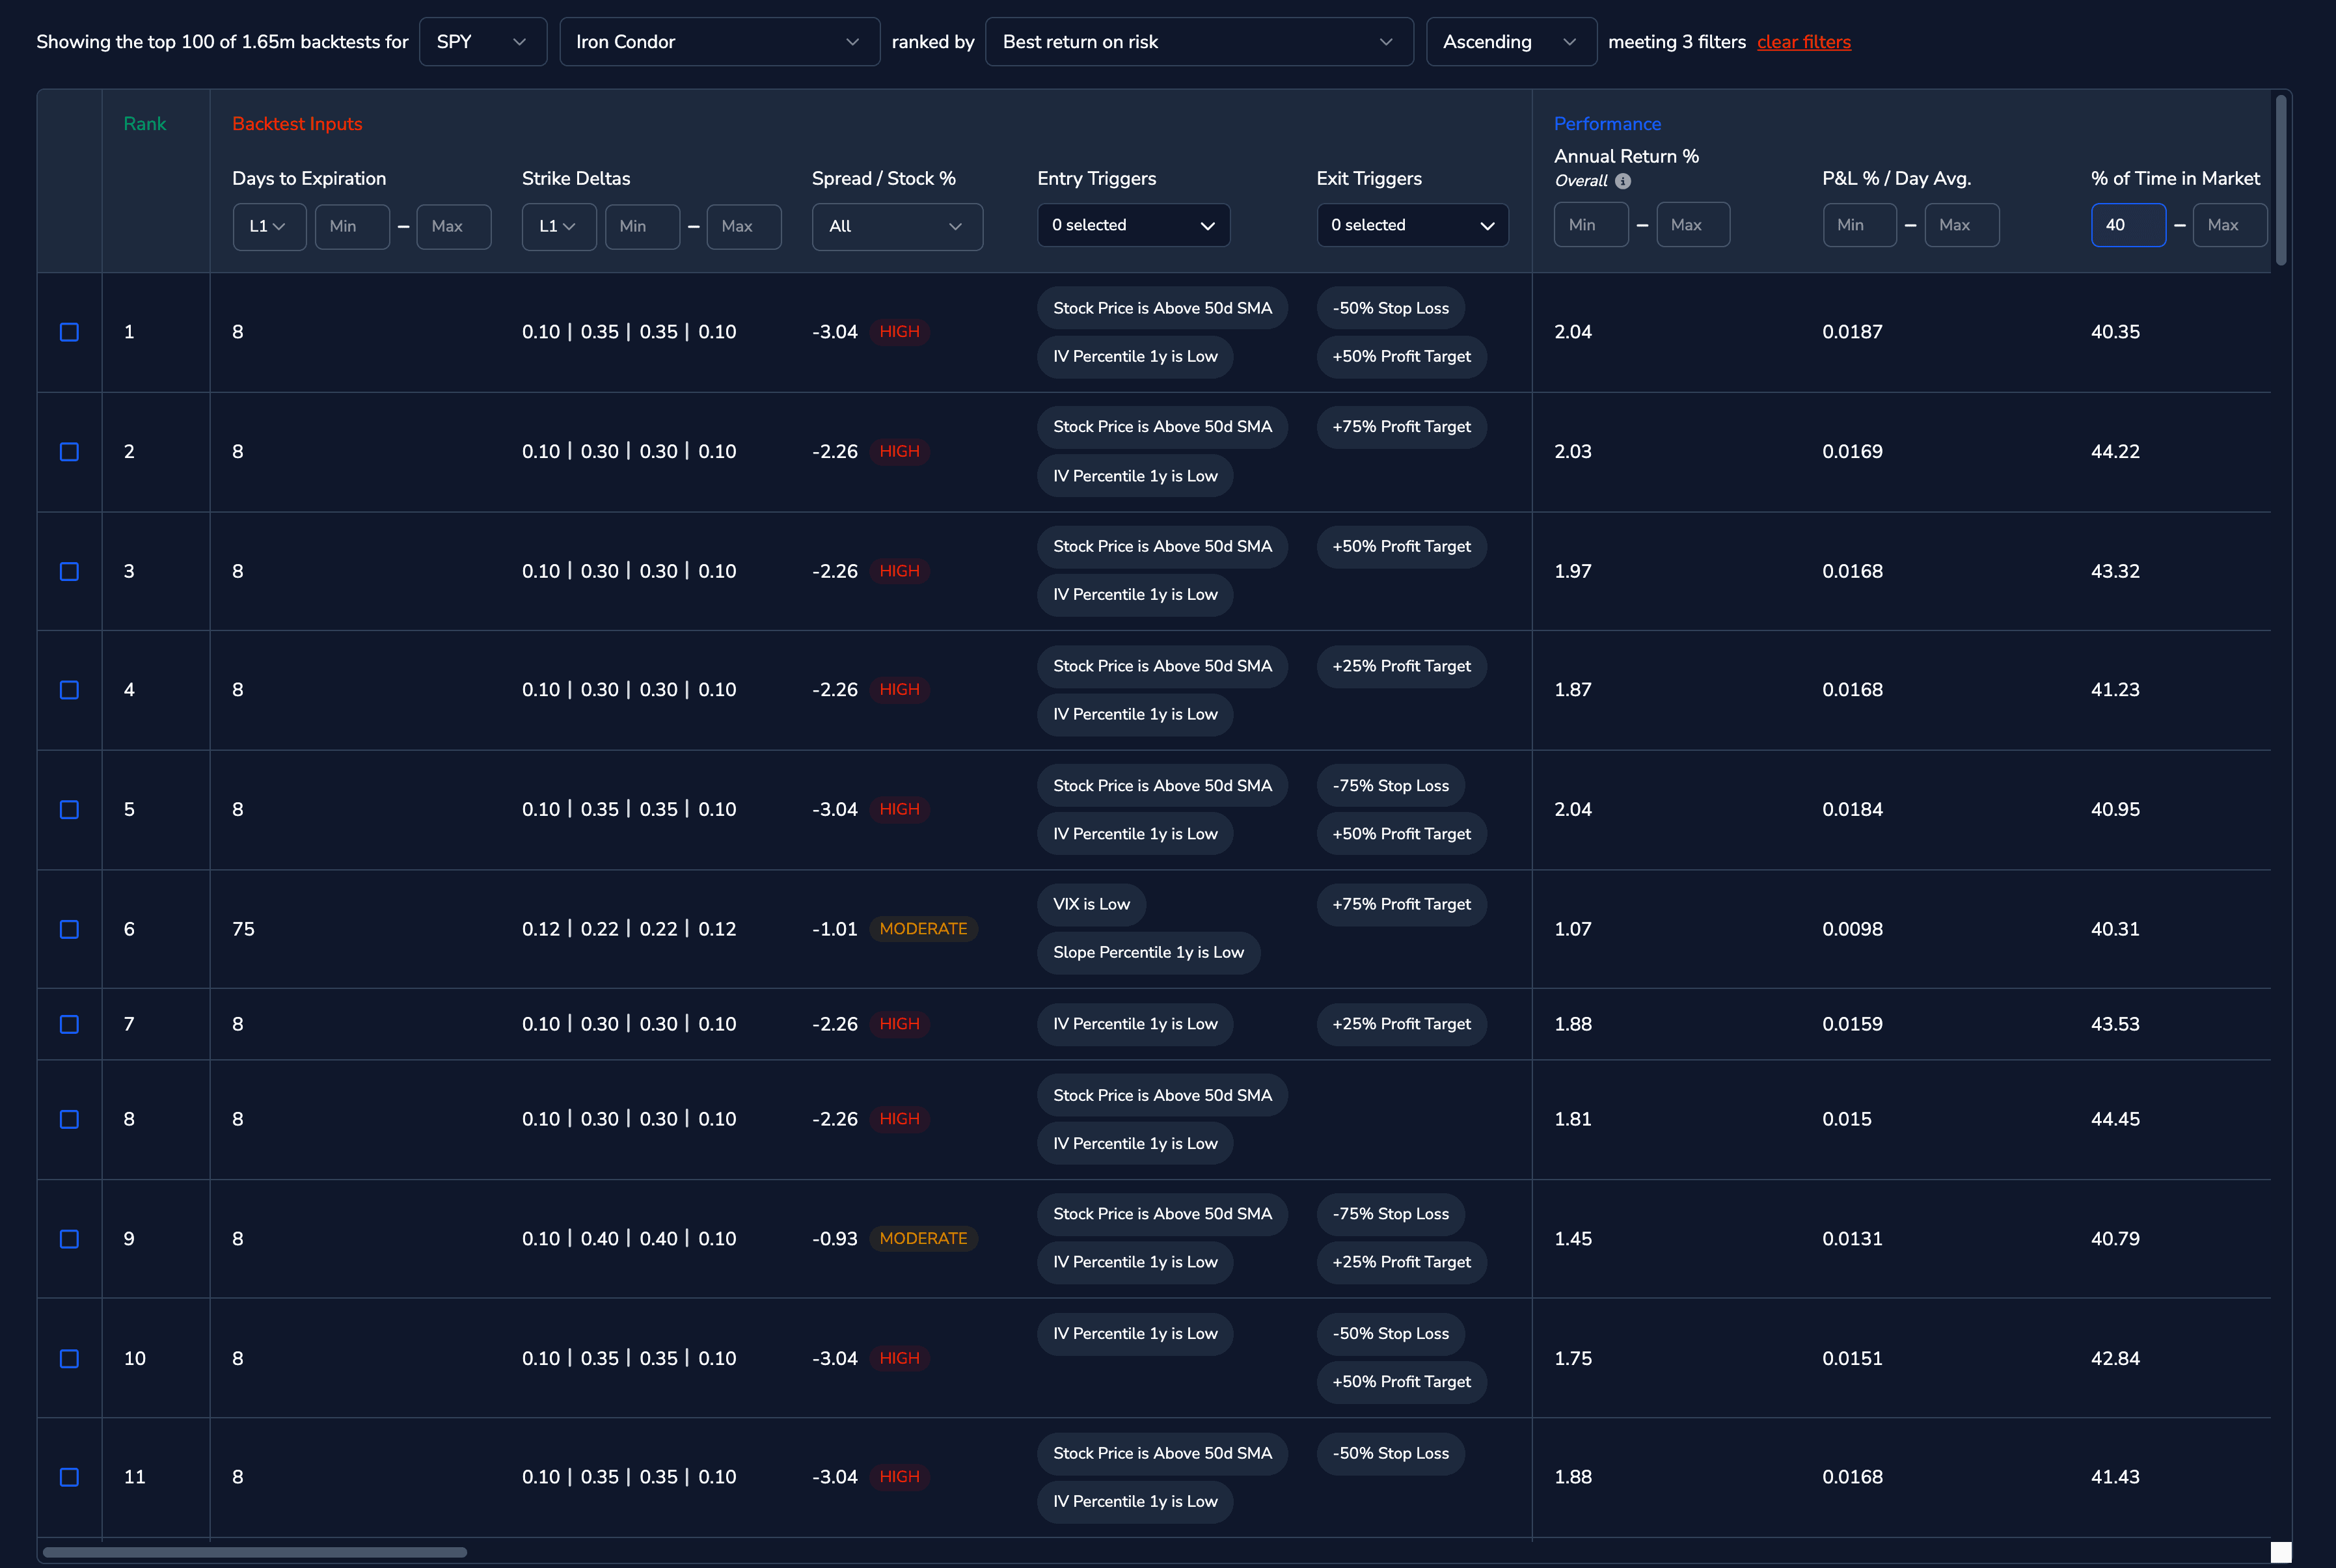
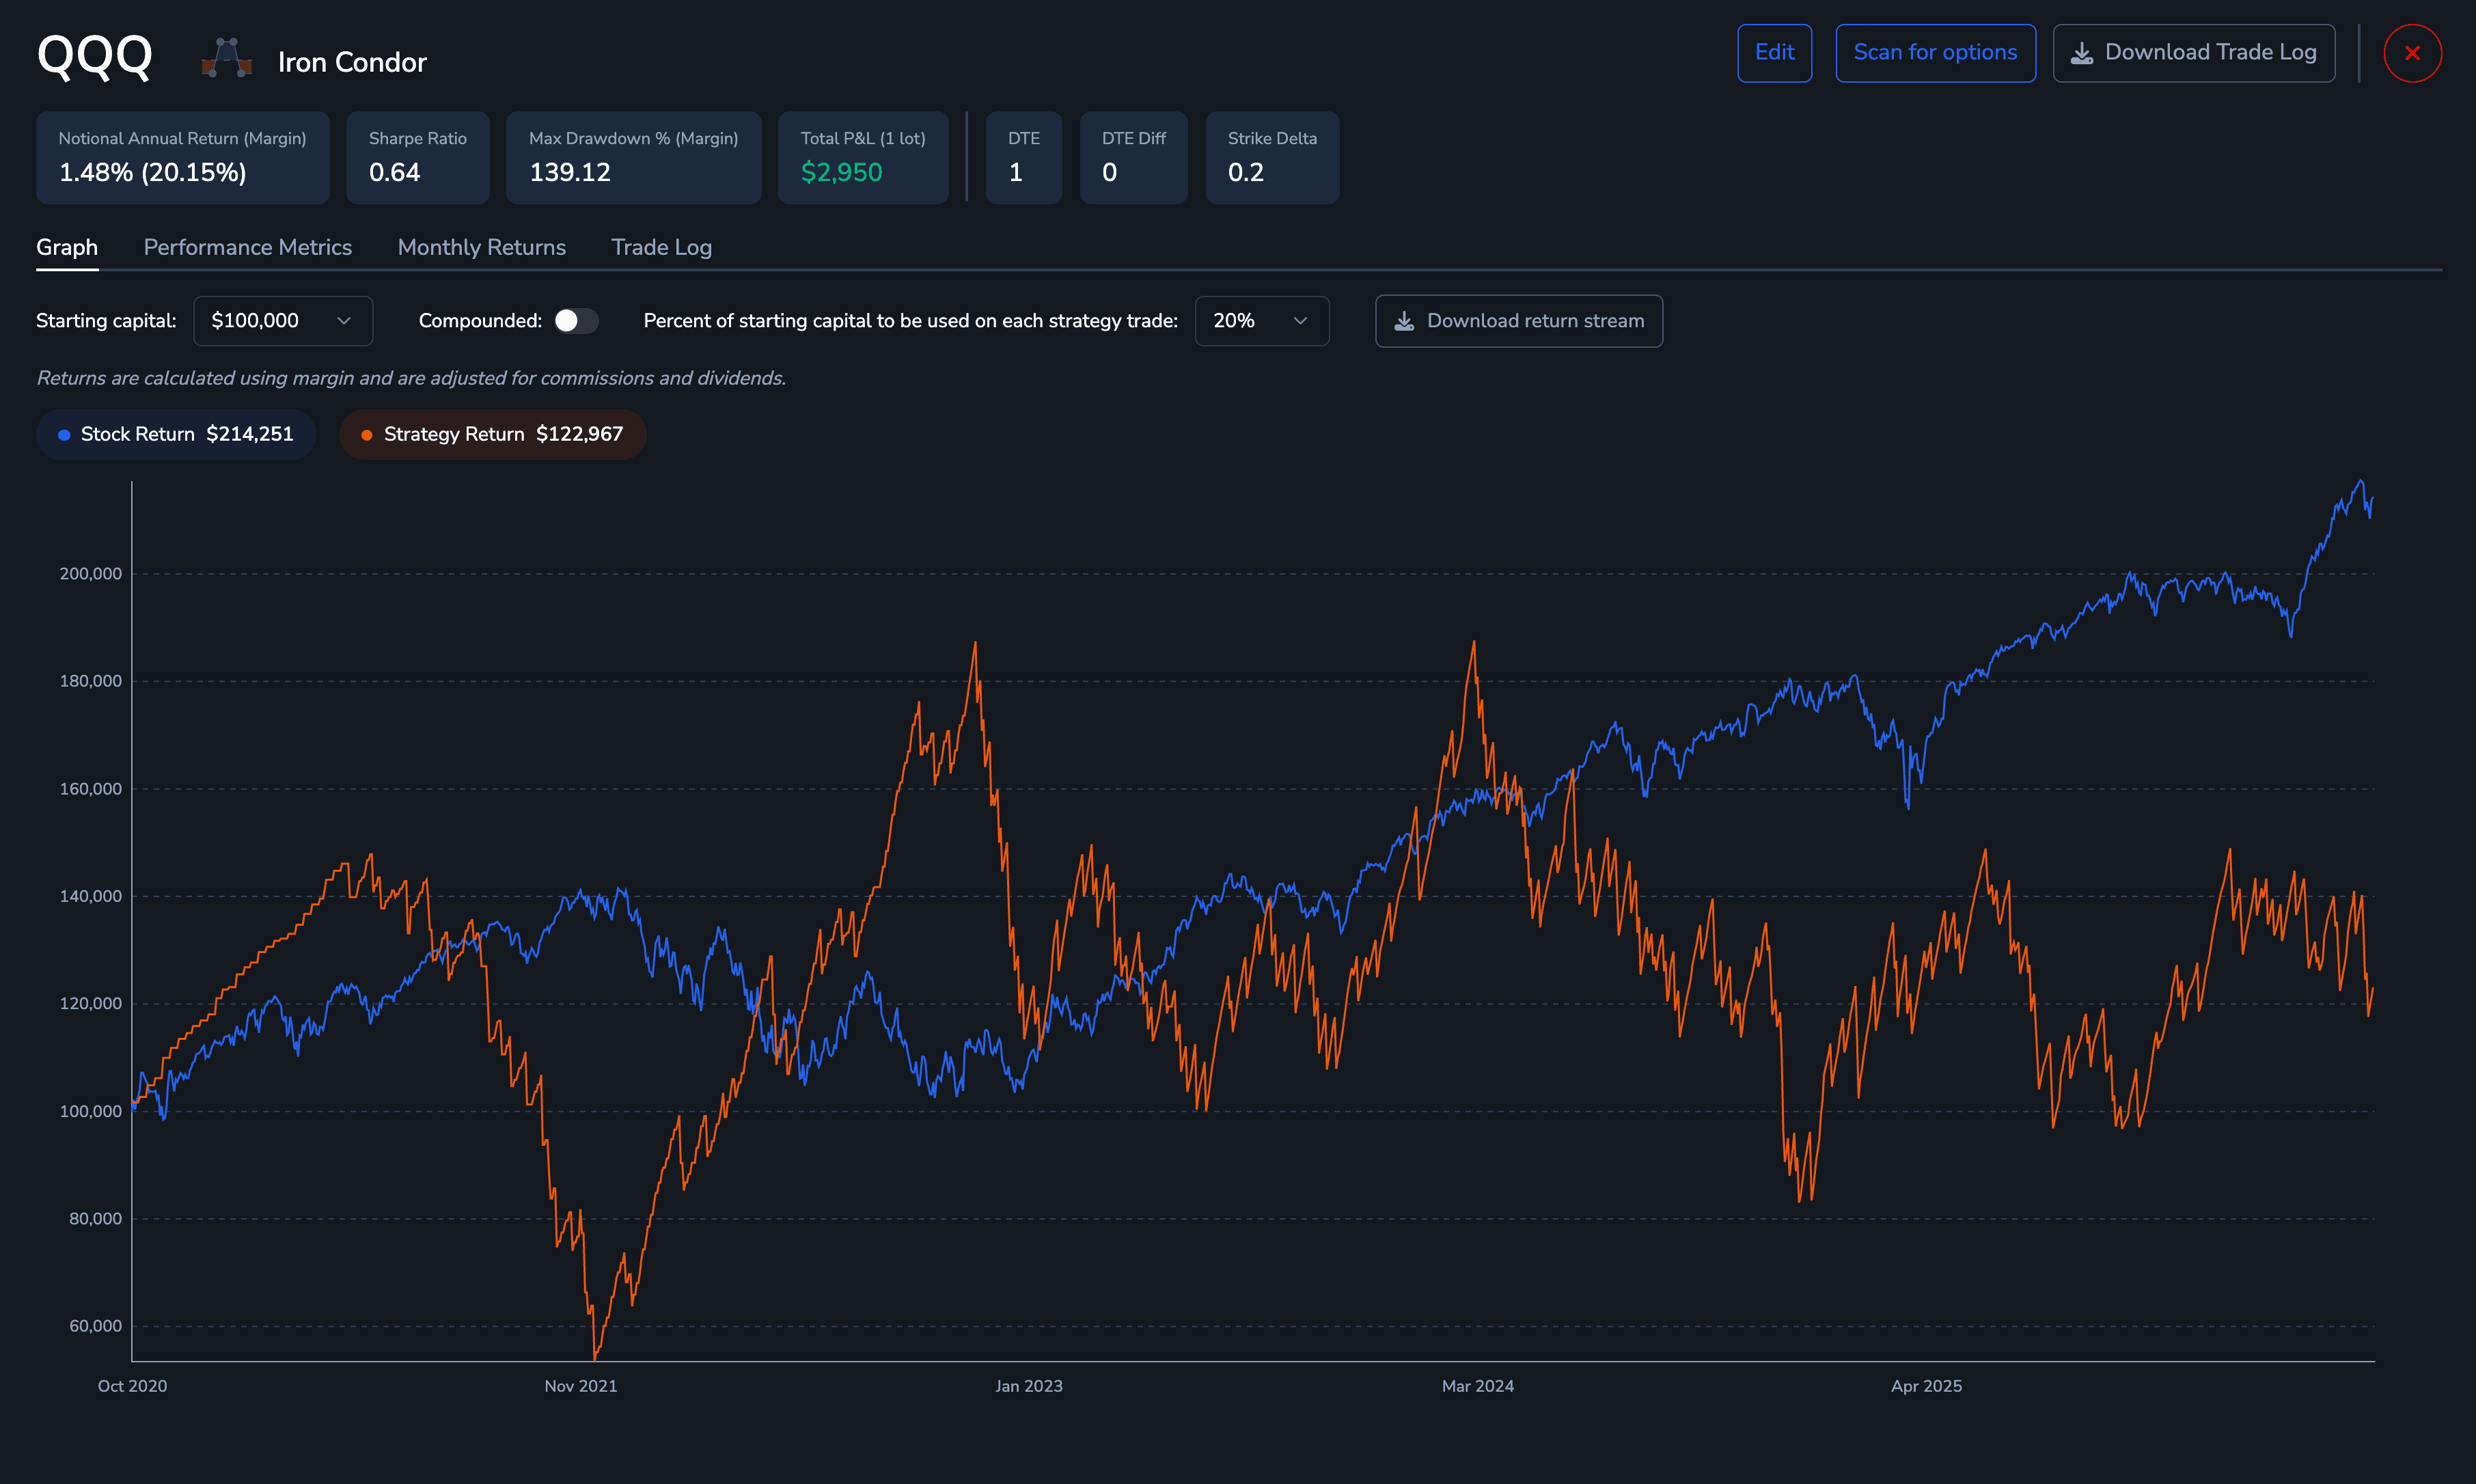
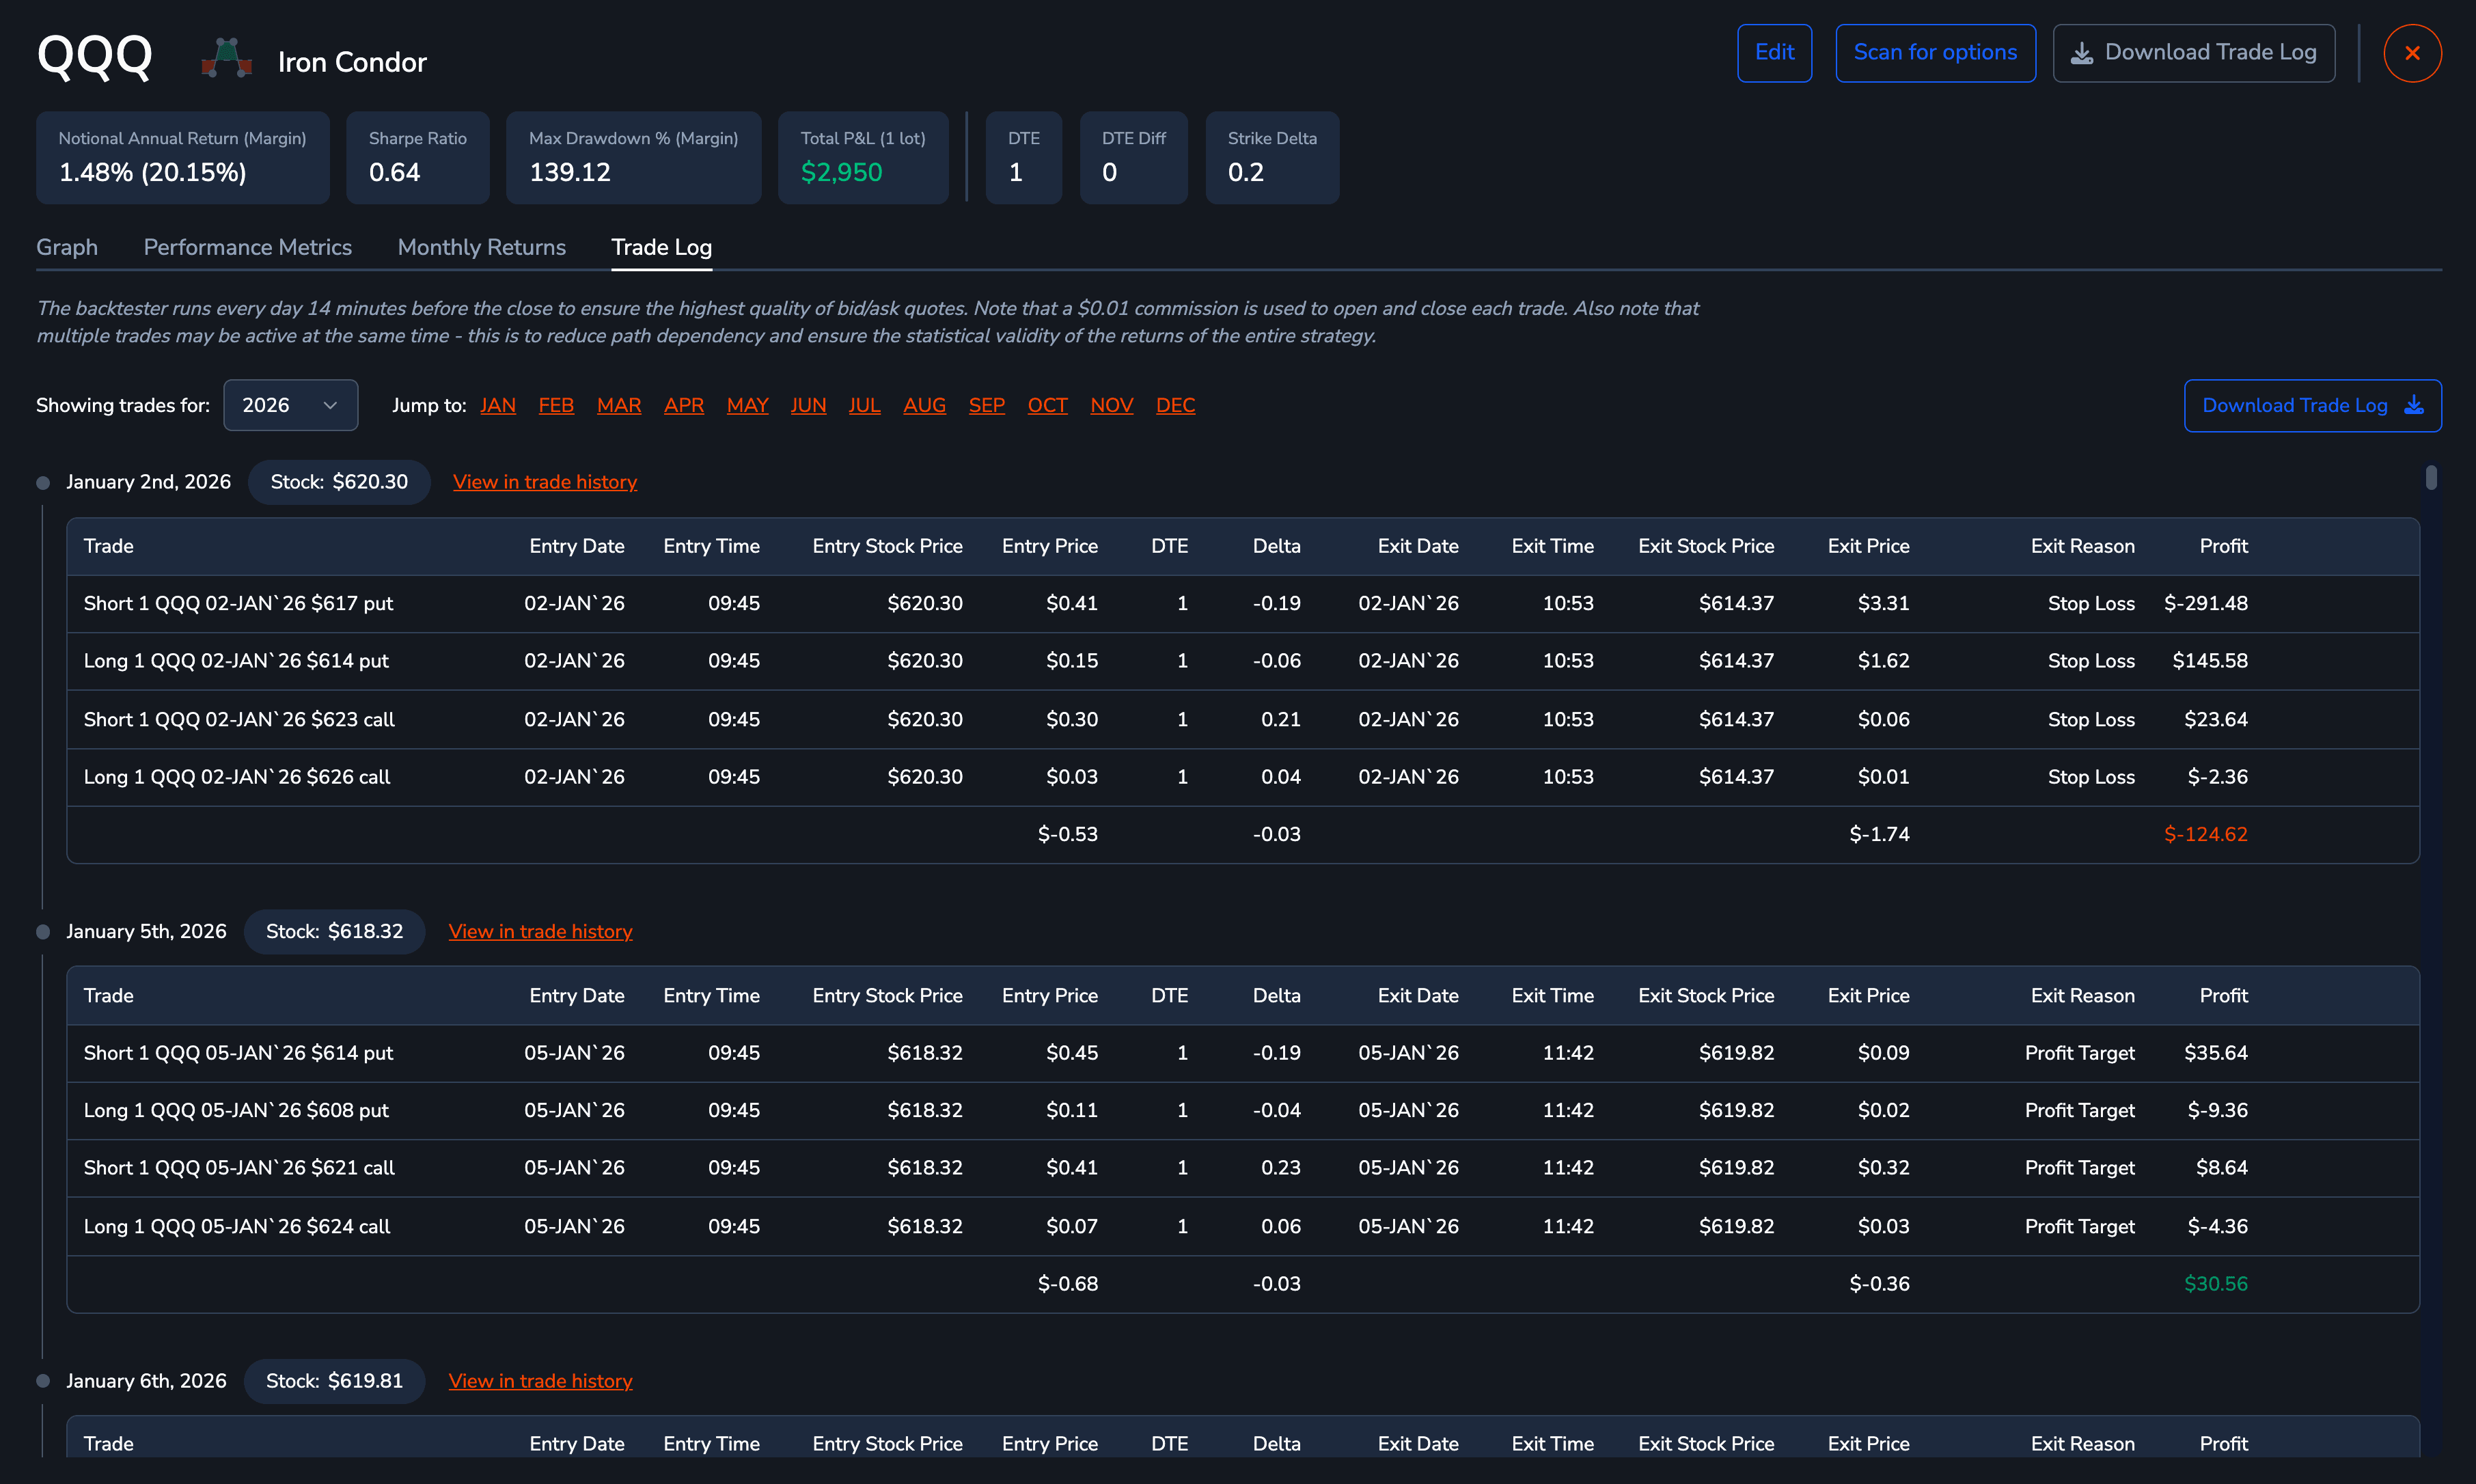
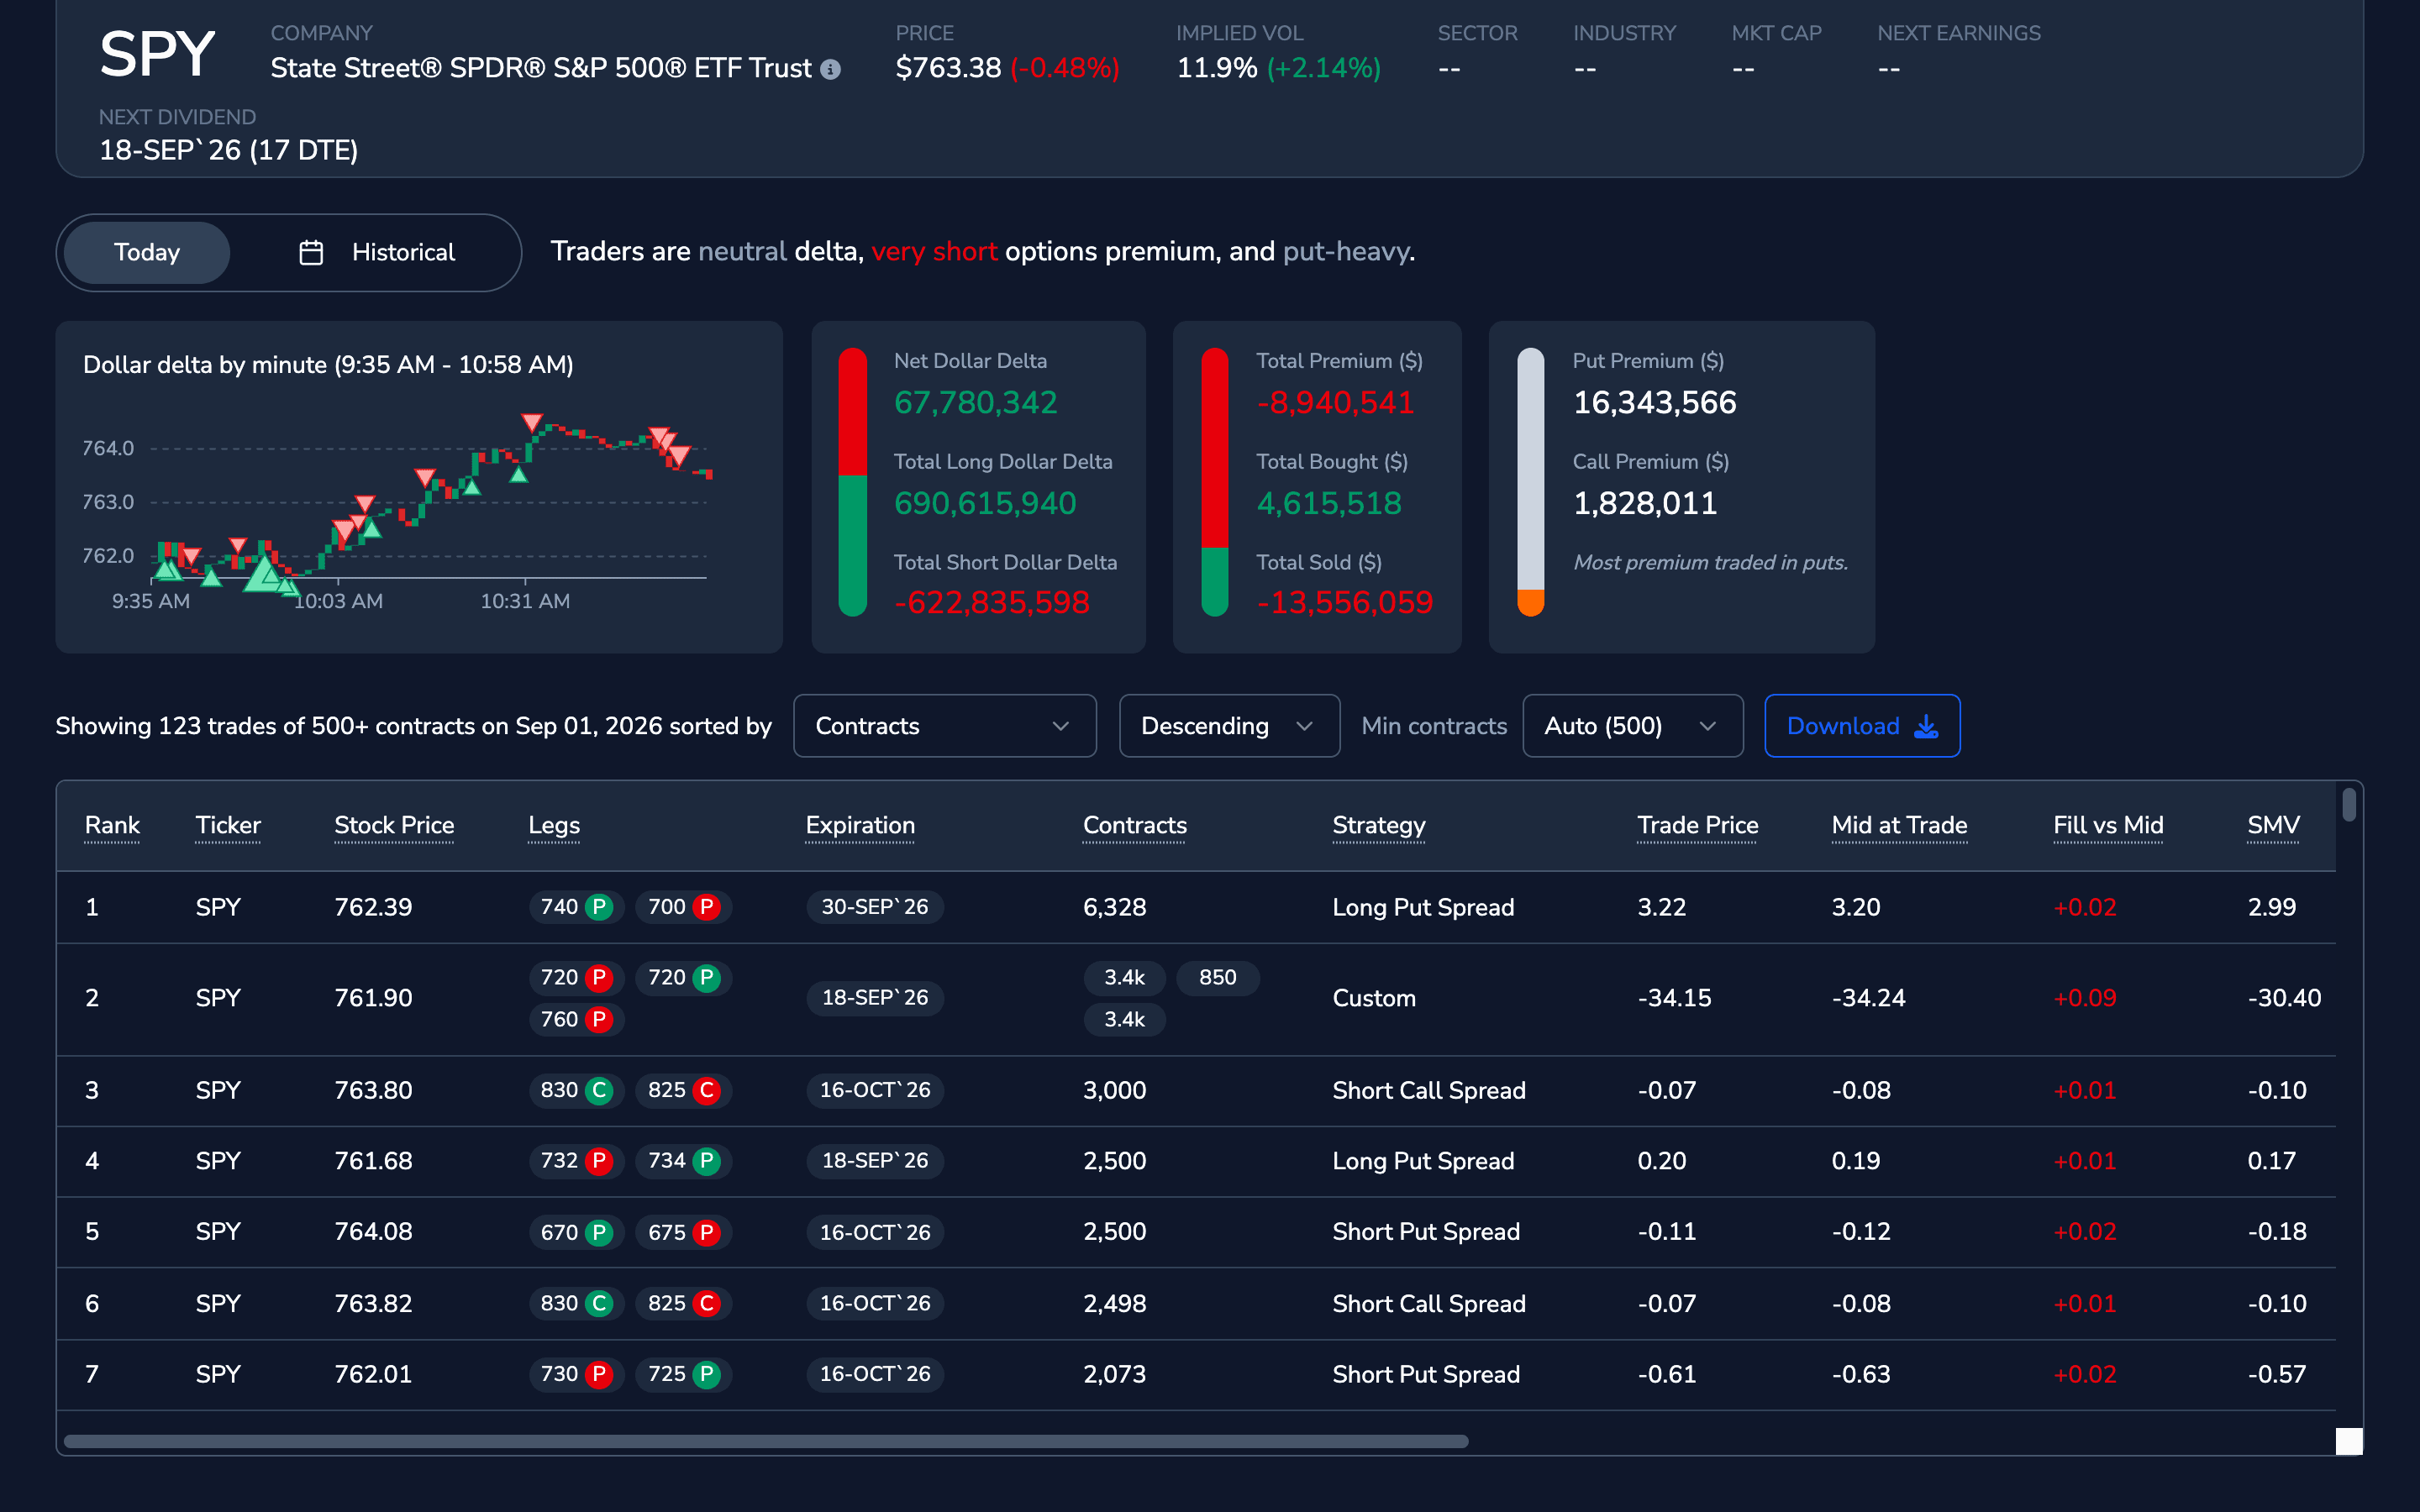
Every screen below is one of these API responses, rendered by the ORATS dashboard.
API Pricing
Delayed Data API
Perfect for getting started
$199
/ month
Add Tools APIs:
NEWIncludes:
20,000 requests per month
Tickers
Strikes + Near EOD History
Strikes by OPRA + Near EOD History
Monies Implied + Near EOD History
Monies Forecast + Near EOD History
SMV Summaries + Near EOD History
Core Data + Near EOD History
Daily Price
Historical Volatility
Earnings History
Stock Split History
IV Rank + History
Live Data API
Best for active traders
$299
/ month
Add Tools APIs:
NEWEverything in Delayed Data API, plus:
100,000 requests per month
Live Strikes
Live Strikes by Expiry
Live Strikes by OPRA
Live Monies Implied
Live Monies Forecast
Live SMV Summaries
Expiration Dates
Note that to access the live endpoints, you must first sign the live data agreements (available after signup).
View API docsLive Intraday API
Every data endpoint, down to the minute
$599
/ month
Add Tools APIs:
NEWEverything in Live Data API, plus:
1,000,000 requests per month
Intraday Strikes Chain
Intraday Strikes Chain History
Intraday Strikes by OPRA
Intraday Strikes by OPRA History
Intraday Monies Implied
Intraday Monies Implied History
Intraday SMV Summaries
Intraday SMV Summaries History
Note that to access the live endpoints, you must first sign the live data agreements (available after signup).
View API docsAll-In API
Access to all ORATS endpoints
$1,395Save $496 / month
$899
/ month
Tools APIs included:
NEWEvery ORATS API in one subscription:
1,000,000 requests per month
Tickers
Strikes + Near EOD History
Strikes by OPRA + Near EOD History
Monies Implied + Near EOD History
Monies Forecast + Near EOD History
SMV Summaries + Near EOD History
Core Data + Near EOD History
Daily Price, Earnings, and Split History
Historical Volatility and IV Rank + History
Live Strikes, by Expiry, and by OPRA
Live Monies Implied and Forecast
Live SMV Summaries and Expiration Dates
Intraday Strikes Chain + History
Intraday Strikes by OPRA + History
Intraday Monies Implied + History
Intraday SMV Summaries + History
End-of-day history back to 2007
One-minute history back to August 2020
Option Scanner API: ranked trade candidatesNEW
Backtest Finder API: 300M+ precomputed backtestsNEW
Intraday Backtester API: custom one-minute backtestsNEW
Time & Sales API: tick-level prints with greeksNEW
Note that to access the live endpoints, you must first sign the live data agreements (available after signup).
View API docsFAQ
The APIs, answered.
What do the data API plans cost?
How far back does the data go?
How do I get live data?
Do you offer a free trial?
How do I track my API usage?
What are the Tools APIs?
Is there an API for the ORATS backtester and option scanner?
How do I authenticate?
How far back does the Time & Sales API go?
What do the Tools APIs cost?
Do I need a Trading Tools subscription?
Can my AI agent use these?